
How to view the "popular narrative": Federal Reserve interest rate cuts → Renminbi appreciation → may harm export competitiveness?

This news pertains to investment research-related information, discussing how the Federal Reserve's interest rate cuts may lead to the appreciation of the Renminbi and its impact on export competitiveness. The core viewpoint suggests that the Federal Reserve's interest rate cuts do not necessarily lead to a weaker dollar, and the appreciation of the Renminbi does not necessarily harm export competitiveness. The valuation of the Renminbi exchange rate is neutral, and stable fluctuations in the short term are the optimal option. In the long term, the exchange rate should be determined by economic fundamentals
Core Viewpoints
1. What is the popular narrative and core logic? Federal Reserve interest rate cuts → Renminbi appreciation → May harm export competitiveness.
2. Where are the weaknesses in the narrative logic? 1) Federal Reserve interest rate cuts "do not necessarily" mean a weakening trend of the US dollar; 2) Renminbi appreciation "does not necessarily" mean a loss of export competitiveness.
3. How to view the future Renminbi exchange rate? We believe that, firstly, the Renminbi exchange rate is neutrally valued, with no issues of overvaluation or undervaluation. Internally, the Renminbi exchange rate has a stable foundation under the resilience of exports and policy support, but the fundamental momentum for a significant upward trend may still need further accumulation. At the same time, the counter-cyclical factors at the policy level have recently continued to suppress appreciation fluctuations; externally, the US's preemptive interest rate cuts may help support its economic growth and relative asset price advantages, combined with the fact that the short positions in the US dollar index have become quite extreme, the pressure for a one-sided continuous decline may be limited. Therefore, the probability of a significant upward trend in the Renminbi against the US dollar may not be high. However, the Renminbi appreciation since May may have released some corporate foreign exchange settlement positions, and the fluctuation range that the Renminbi exchange rate can withstand may correspondingly widen. It should also be noted that the remaining backlog of foreign exchange positions may be released at the important integer level of 7.0, amplifying appreciation fluctuations.
In the long run, only a significant appreciation supported by economic fundamentals is sustainable, bearable, and desirable. Although the exchange rate may seem like a tool and reason that can be manipulated in the short term, in the long term it should be the result of the economy, which is difficult to force; it tends to be a posteriori rather than a priori of the fundamentals. The future of the Renminbi exchange rate depends on many complex factors. However, stable fluctuations (with limited appreciation) still appear to be the optimal option at present.
Report Summary
- Regarding the popular narrative on exchange rates: Federal Reserve interest rate cuts → Renminbi appreciation → May harm export competitiveness?
Recently, discussions related to Renminbi appreciation have surged, with a core narrative chain receiving significant attention, namely Federal Reserve interest rate cuts → US dollar weakness → Renminbi appreciation → May harm China's export competitiveness.
- Is the narrative logic solid? One solid and two unsolid
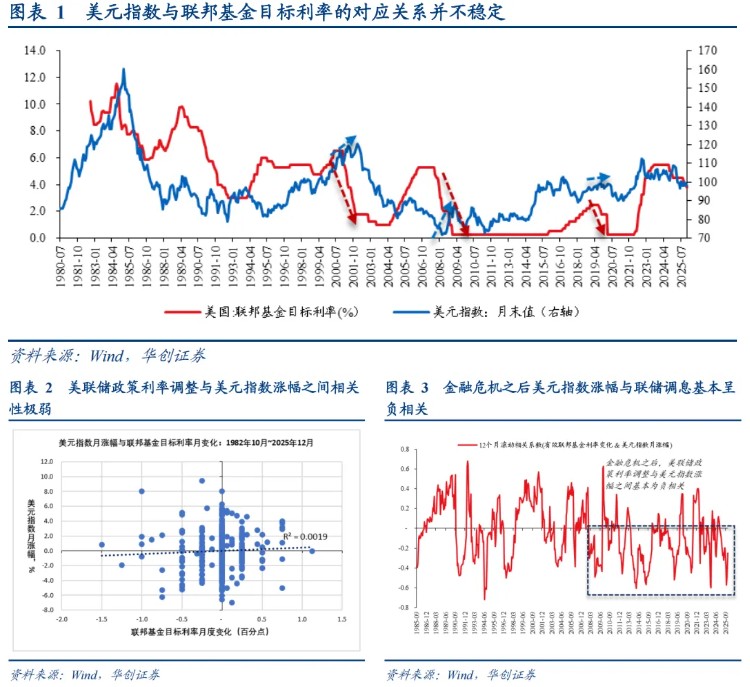
(1) Federal Reserve interest rate cuts → US dollar trend weakness? — Not solid
From the perspective of the US dollar index and Federal Reserve policy interest rate trends, the correspondence between the two is not stable. It is not uncommon for the federal funds target rate to decline while the US dollar index rises. From a monthly correlation coefficient perspective, since October 1982, the correlation coefficient between monthly adjustments in Federal Reserve policy interest rates and monthly increases in the US dollar index is only 0.04.
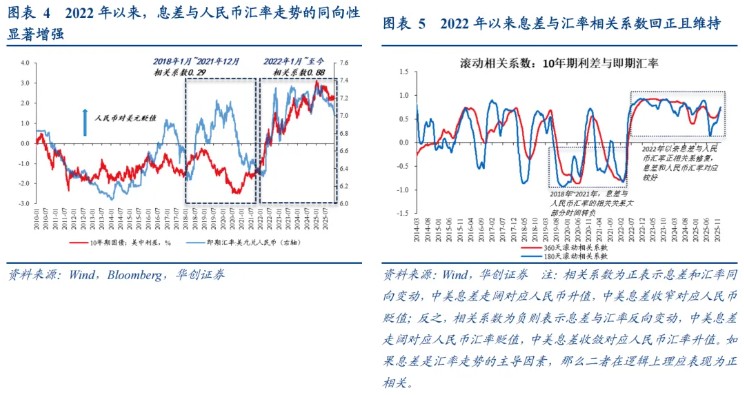
(2) Convergence of Sino-US interest rate differentials → Renminbi trend appreciation? — Relatively solid
From the trend perspective, since 2022, the directional correlation between interest rate differentials and Renminbi exchange rate trends has significantly strengthened. From a monthly correlation coefficient perspective, from January 2022 to the present, the correlation coefficient between Sino-US interest rate differentials and spot exchange rates has reached as high as 0.88.
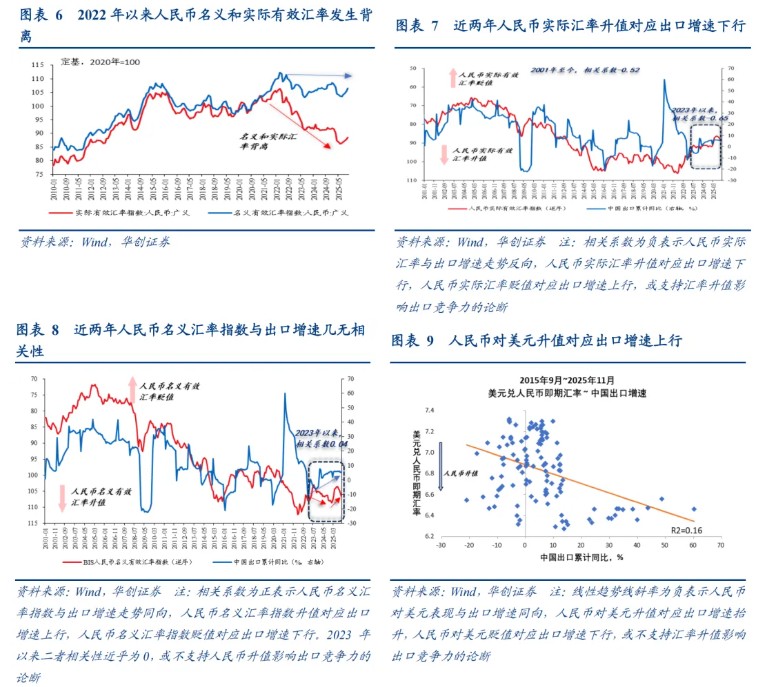
(3) Renminbi appreciation → Export competitiveness harmed? — Not solid
We observe the three-dimensional measurement of the Renminbi exchange rate — bilateral exchange rate (USD to Renminbi spot exchange rate), nominal effective exchange rate, real exchange rate index, and export growth rate (as a proxy variable for measuring export competitiveness) — the only relationship that may demonstrate that exchange rate appreciation affects export competitiveness is between the real exchange rate and exports. In terms of nominal exchange rates, whether in a basket or bilateral exchange rate, they do not support the assertion that exchange rate appreciation affects export competitiveness However, the current market discussion about the appreciation of the Renminbi is actually more limited to the bilateral exchange rate category, specifically the appreciation against the US dollar.
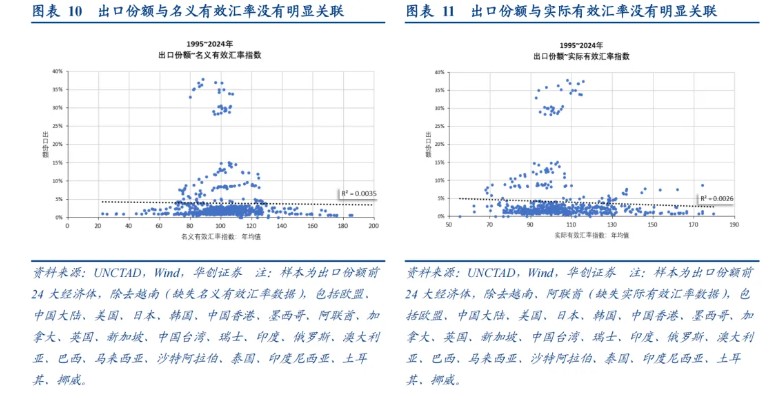
Additionally, based on international experience, the export share of major countries or regions (used to measure export competitiveness) has basically no correlation with the nominal effective exchange rate index and the real effective exchange rate index, with the R² of the linear trend line being close to 0, which does not support the assertion that exchange rate appreciation affects export competitiveness.
Three, what are the two-stage attributions for this year's Renminbi appreciation?
We decompose the main contributing factors to exchange rate fluctuations based on the pricing formula of the central parity, with the core logic and methods detailed in the main text. The results show that although the Renminbi exchange rate has continued to appreciate since the second quarter of this year, it can actually be divided into two stages based on the differences in core driving factors:
The first stage is from mid-April to November, primarily driven by policy support. This is characterized by the counter-cyclical factor shadow being the dominant force behind the appreciation of the central parity, meaning that the spot exchange rate readings consistently exceed the Renminbi central parity readings (indicating that the spot exchange rate is depreciated compared to the central parity), with the central parity "pulling" the spot exchange rate up.
The second stage is from the end of November to the present, primarily driven by market supply and demand. This is characterized by domestic supply and demand becoming the dominant force behind the appreciation of the central parity, with external responses as a supplement (the US dollar index trending weaker), while the counter-cyclical factor shadow plays a role in smoothing out excessive appreciation fluctuations. The spot exchange rate readings have turned to be lower than the Renminbi central parity readings (indicating that the spot exchange rate is appreciated compared to the central parity), with the spot exchange rate "pulling" the central parity up.
Four, outlook for the Renminbi exchange rate
Based on the retrospective attribution of this year's Renminbi appreciation, we focus on four key factors for the future exchange rate trend:
(1) First, look at the valuation factor: Is the exchange rate expensive or cheap?
From the perspective of interest rate differentials and single exchange rates, or from the perspective of export competitiveness and a basket of exchange rates, the Renminbi does not have an overvaluation/undervaluation issue, deviating from the "value center" by about 0% to 2%, which is within a reasonable pricing range.
(2) Second, look at policy orientation: How does the counter-cyclical shadow move?
Will the counter-cyclical factor shadow be utilized, and how will it be utilized? Currently, it appears that the counter-cyclical factor shadow has shifted from guiding the stable appreciation of the Renminbi to smoothing out excessive appreciation fluctuations, reflecting that the policy aims to maintain stability rather than guide the market to form expectations of a one-sided Renminbi exchange rate trend.
Furthermore, looking back, how should we understand the "efforts" of the counter-cyclical factor shadow during the first stage of appreciation? We believe that, in addition to the backdrop of Sino-US trade frictions, there may also be considerations for risk prevention, rather than intentionally guiding the exchange rate to form a one-sided trend. This is because, over the past three years, strong exports but stronger willingness of enterprises to hold foreign exchange have led to a significant accumulation of foreign exchange positions by enterprises, constituting a "quasi-carry trade" for the Renminbi. If released in an uncontrolled manner, it could cause severe market fluctuations and directly impact corporate profits. In this context, a moderate appreciation of the exchange rate under policy regulation may help facilitate the orderly release of accumulated foreign exchange positions.
In contrast, the current Renminbi exchange rate has shifted to appreciation primarily driven by domestic supply and demand, which may indicate that foreign exchange settlement is being released, and attention should be paid to the pace of release to prevent excessive fluctuations in the exchange rate that could trigger risks. This may also explain why the counter-cyclical factor shadow has shifted to smoothing out appreciation fluctuations. Future attention should still be closely paid to the movements of the counter-cyclical factor shadow
(3) Three Views on Domestic Supply and Demand: Flow Logic vs Stock Logic
The third view on domestic supply and demand is essentially the fundamental supply and demand for foreign exchange, namely the settlement of foreign exchange.
- Flow Logic: Trade Surplus (depends on exports) × Net Settlement Rate (depends on PMI)
Typically, we focus on flow logic, which posits that the current net settlement depends on current foreign exchange income and the willingness of enterprises to settle, with the core factors being exports and PMI. Historical reviews show that flow logic is effective, and the RMB exchange rate tends to be retrospective; before the trend of appreciation begins, there is often an observable improvement in the settlement balance, with deficits gradually narrowing to surpluses, driven by an upward trend in PMI, which supports a continuous upward fluctuation in the net settlement rate. This was the case during the trend appreciation of the RMB in 2017 and 2020.
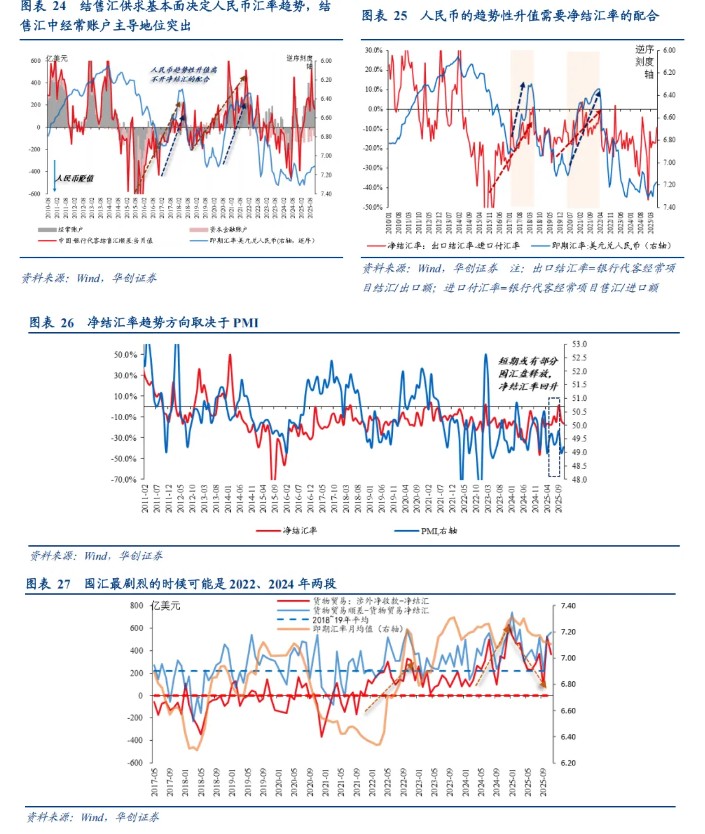
From this logic, it is currently expected that the external demand environment next year is likely to remain stable under the support of broad monetary policies in Europe and the United States, and exports may maintain resilience; however, the domestic manufacturing PMI is still fluctuating and may still be accumulating momentum for a trend rebound (Figure 26).
- Stock Logic: The release of the backlog of pending settlements may still amplify appreciation fluctuations
It is particularly important to note that over the past three years, China's exports have generally been strong, and the trade surplus has significantly expanded, but enterprises have a strong willingness to hold foreign exchange, with settlement rates lower than in the past, which may have formed a large backlog of pending settlements. If this is released, it may have a significant impact on the current net settlement.
Whether the stock of foreign exchange is released is influenced by an important factor: its exchange rate cost. A simple observation of the data shows that "holding foreign exchange without settling" mainly occurred in 2022 and 2024, during which the spot exchange rate fluctuated around 7 (averaging about 6.96), with annual averages of 6.7 and 7.2 respectively. From this perspective, as the spot exchange rate broke 7.2 in late May this year, the stock of foreign exchange accumulated in 2024 may see some release. Data shows that since May, the net foreign exchange receipts from goods trade and the net settlement balance have indeed converged significantly. Moving forward, as the spot exchange rate approaches the integer threshold of 7.0, the stock of foreign exchange accumulated in 2022 may gradually be released, potentially amplifying exchange rate appreciation fluctuations.
(4) Four Views on External Market Response: How will the dollar move?
We believe that from a fundamental perspective, we are currently in a phase of preventive interest rate cuts, which may provide a bottom for the U.S. economic fundamentals. Over the next year, the U.S. is likely to maintain a relative economic growth advantage over Europe and Japan. Historical reviews show that after the Federal Reserve cuts interest rates without falling into economic recession, the dollar tends to be strong initially and then flatten out, rather than continuously weakening; combined with trading perspectives, the current short positions in the dollar index are already quite extreme, making the probability of a sustained unilateral weakening of the dollar low. (Detailed data analysis can be found in the main text)
Report Body
1. On the Popular Narrative of Exchange Rates: Federal Reserve Rate Cuts → RMB Appreciation → Potential Damage to Export Competitiveness?
Recently, the appreciation of the RMB has accelerated, with the onshore spot exchange rate continuously approaching the important integer threshold of 7.0. Against this backdrop, discussions related to RMB appreciation have surged, with a core narrative chain receiving significant attention: Federal Reserve rate cuts → dollar weakening → RMB appreciation → potentially harming China's export competitiveness, which includes two sub-narrative logics: first, the market expects the Federal Reserve to continue cutting rates next year, narrowing the interest rate differential between China and the U.S., leading to a weaker dollar, which is favorable for the continued appreciation of the RMB; Secondly, the rapid appreciation of the RMB exchange rate may impact China's export competitiveness.
II. Is the narrative logic solid? One stable and two unstable
In our view, the solidity of the two major sub-logics mentioned above is debatable.
(1) Federal Reserve rate cuts → Weakening dollar trend? — Unstable
From the perspective of the relationship between the dollar index and the Federal Reserve's policy interest rates, the correspondence between the two is not stable. It is not uncommon for the federal funds target rate to decline while the dollar index rises (Figure 1).
From the monthly correlation coefficient, since October 1982, the correlation coefficient between the monthly adjustments of the Federal Reserve's policy interest rates and the monthly increase in the dollar index is only 0.04 (Figure 2).
From the dynamic correlation coefficient, after the financial crisis, the increase in the dollar index has been basically negatively correlated with the Fed's interest rate adjustments, with the 12-month rolling correlation coefficient being negative most of the time (Figure 3).
(2) Convergence of China-U.S. interest rate differentials → RMB trend appreciation? — Relatively stable
From the trend perspective, since 2022, as the impact of the pandemic has faded, traditional factors such as economic fundamentals and monetary policy have gradually highlighted their dominant role in the exchange rate; coupled with the Federal Reserve initiating an unprecedented rapid interest rate hike cycle, which significantly widened the interest rate differential fluctuations, or strengthened the marginal impact of the interest rate differential on the exchange rate, the data reflects that the correlation between the interest rate differential and the RMB exchange rate trend has significantly increased (Figure 4). In contrast, from 2018 to 2021, the dominant role of the interest rate differential on exchange rate fluctuations was weaker due to external factors such as China-U.S. trade frictions and the pandemic impact, leading to a prolonged divergence between the two.
From the monthly correlation coefficient, from January 2022 to the present, the correlation coefficient between the China-U.S. interest rate differential and the spot exchange rate is as high as 0.88.
From the dynamic correlation coefficient, since 2022, the correlation coefficient between the interest rate differential and the exchange rate has remained positive, indicating that the two are moving in the same direction, which aligns with the logic that the interest rate differential is the dominant factor in exchange rate fluctuations (Figure 5).
(3) RMB appreciation → Export competitiveness impaired? — Unstable
It should be noted that the RMB exchange rate has multiple dimensions: first, the bilateral exchange rate that attracts the most market attention, which is the spot exchange rate of the U.S. dollar against the RMB; second, a basket of nominal exchange rates, represented by the RMB exchange rate index compiled by the Foreign Exchange Trading Center (CFETS RMB Exchange Rate Index), which is weighted by trade volume using 24 major trading partner currencies; third, the real exchange rate, usually measured by the broad real exchange rate index of the RMB compiled by the Bank for International Settlements (BIS). It is important to emphasize that the first two categories belong to nominal exchange rates, while only the third category measures the real exchange rate that reflects relative purchasing power of the currency.
From the data trend, in the past three years, there has been a significant divergence between the actual and nominal exchange rates of the RMB. Referring to the nominal and real exchange rate indices of the RMB compiled by the BIS, the two were basically completely synchronized before 2022, but since 2022, a significant divergence has occurred: the nominal exchange rate index has remained roughly flat, while the real exchange rate index has depreciated significantly (Figure 6) Therefore, the first thing that needs to be clarified is which type of appreciation of the Renminbi is referred to in the assertion that "appreciation may affect export competitiveness."
Theoretically, according to the purchasing power parity theory, the same product should satisfy the law of one price, meaning that the selling price should be the same after conversion in different countries. If there is a difference, the country with a lower selling price after conversion has a relative competitive advantage in exports. Therefore, the nominal exchange rate and relative price levels are key factors affecting the relative competitive advantage of exports, that is, the real exchange rate (= nominal exchange rate × relative price level). Under the short-term nominal price rigidity, with prices unchanged, adjustments in the nominal exchange rate will also lead to changes in the real exchange rate, thereby affecting the relative competitive advantage of exports.
In reality, from the perspective of the Renminbi exchange rate and export data, only the relationship between the real exchange rate and exports may demonstrate that exchange rate appreciation affects export competitiveness. Under the nominal exchange rate, whether in a basket or bilateral exchange rate, it does not support the assertion that exchange rate appreciation affects export competitiveness. However, the current market discussion about the appreciation of the Renminbi is actually more limited to the bilateral exchange rate category, specifically the appreciation against the US dollar. We use export growth rate as a rough measure of export competitiveness and observe the following: ① In the past two years, the trend of the real exchange rate of the Renminbi and export growth has been inversely correlated (the correlation coefficient since 2023 is -0.65, Figure 7), with the appreciation of the real exchange rate corresponding to a decline in export growth, which may reflect that exchange rate appreciation affects export competitiveness. ② In the past two years, there has been almost no correlation between the nominal exchange rate index of the Renminbi and export growth (the correlation coefficient since 2023 is 0.04, Figure 8), which may not support the assertion that Renminbi appreciation affects export competitiveness. ③ The performance of the Renminbi against the US dollar is positively correlated with export growth, with the appreciation of the Renminbi against the US dollar (the spot reading of USD to Renminbi decreases) corresponding to an increase in export growth (Figure 9). However, the correlation is weak, with a linear trend R2 of only 0.16, which may not support the assertion that exchange rate appreciation affects export competitiveness.
Additionally, from international empirical data (Figures 10-11), the export shares of major countries or regions (used to measure relative export competitiveness) show basically no correlation with the nominal effective exchange rate index and the real effective exchange rate index, with the linear trend line R2 being essentially 0, which does not support the assertion that exchange rate appreciation affects export competitiveness.
III. The Two-Part Attribution of Renminbi Appreciation This Year
Since the two sub-narratives currently being discussed in the market are not very solid, how should we view the future of the Renminbi exchange rate? Analyzing the driving factors behind the current appreciation of the Renminbi can provide a basis for future outlook. We break down the main contributing factors to exchange rate fluctuations based on the pricing formula of the central parity, with the core logic being:
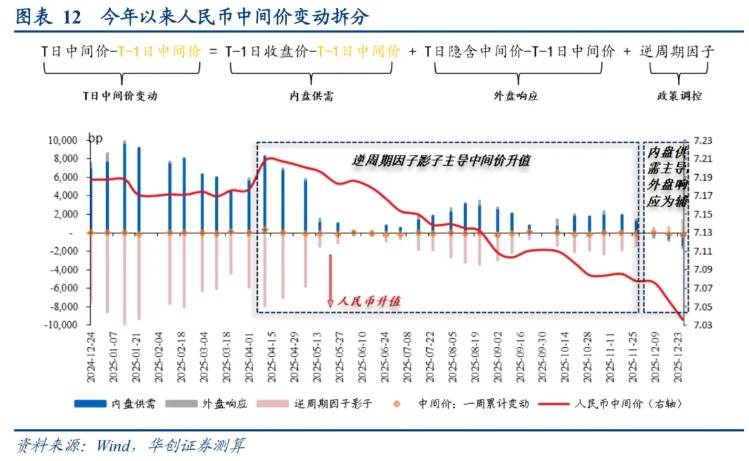
Renminbi central parity = previous day's spot exchange rate closing price + basket exchange rate changes (implied changes in central parity) + counter-cyclical factor The change in the RMB central parity rate = RMB central parity rate – previous day's central parity rate = previous day's spot exchange rate closing price – previous day's central parity rate + a basket of exchange rate changes (implied central parity rate change) + counter-cyclical factor.
Among them, "previous day's spot exchange rate closing price – previous day's central parity rate" reflects the supply and demand situation in the domestic market (the core is corporate foreign exchange settlement and sales), while the basket of exchange rate changes (implied central parity rate change) reflects the external exchange rate changes in the night market (the core is the rise and fall of the US dollar index), and the counter-cyclical factor reflects policy management and regulation.
Based on the above decomposition formula, we find that although the RMB exchange rate has continued to appreciate since the second quarter of this year, it can actually be divided into two phases based on the differences in core driving factors:
The first phase is from mid-April to November, mainly driven by policy support. This is characterized by the counter-cyclical factor being the dominant force behind the appreciation of the central parity rate, with the spot exchange rate readings consistently higher than the RMB central parity rate readings (indicating that the RMB spot exchange rate is depreciated compared to the central parity rate), with the central parity "pulling" the spot exchange rate up.
The second phase is from the end of November to the present, mainly driven by market supply and demand. This is characterized by domestic supply and demand becoming the dominant force behind the appreciation of the central parity rate, with external responses as a supplement (the US dollar index trending weaker), and the counter-cyclical factor playing a role in smoothing out excessive appreciation fluctuations. The spot exchange rate readings have turned to be lower than the RMB central parity rate readings (indicating that the RMB spot exchange rate is appreciated compared to the central parity rate), with the spot exchange rate "pulling" the central parity rate up.
The biggest difference between these two phases of appreciation is the change in the role of the counter-cyclical factor, which means that policy has shifted from supporting appreciation to smoothing out excessive fluctuations. The deeper background is that the market supply and demand situation has changed, reflected in the spot exchange rate shifting from being "passively" pulled up by the central parity rate to "actively pulling" the central parity rate up.
(1) First phase (mid-April to November): Mainly policy support
The appreciation interval of the first phase is from April 16 to November 25, during which the RMB central parity rate appreciated from around 7.21 to around 7.08, with an average monthly appreciation of about 186 basis points. The cumulative change in the central parity rate was -1,307 basis points, with domestic supply and demand cumulatively contributing +40,470 basis points, external responses cumulatively contributing +604 basis points, and the counter-cyclical factor cumulatively contributing -42,381 basis points.
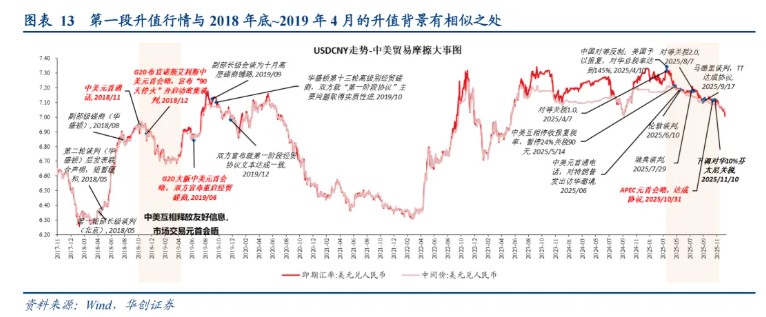
The background of this appreciation phase is: Initially, the China-US trade friction intensified sharply, followed by gradual negotiations and contacts between China and the US, which may have had some impact on market sentiment and policy regulation tendencies. In the context of China-US trade friction, the appreciation trend in the first phase of the exchange rate bears some similarity to the period of intensive negotiations and contacts between China and the US from the end of 2018 to April 2019: the current spot exchange rate fell from a high of 7.35 to 7.08, a decrease of 0.27; at that time, the spot exchange rate fell from a high of 6.97 to 6.69, a decrease of about 0.28. However, there is a significant difference: the current counter-cyclical factor has remained significant during the exchange rate appreciation period, indicating that the policy may intentionally guide the RMB to rise steadily; At that time, there was no sign of the counter-cyclical factor.
(2) Second Phase (End of November to Present): Market Supply and Demand as the Main Factors
The appreciation range of the second phase is from November 26 to the present, where the RMB central parity has further appreciated from around 7.08 to just slightly above 7.04. In about a month, it appreciated by over 450 basis points (in stark contrast to the appreciation rate under the policy support in the first phase). The cumulative change in the central parity is -468 basis points, with the cumulative domestic supply and demand at -2,388 basis points, the cumulative external response at -672 basis points, and the cumulative counter-cyclical factor shadow at +2,592 basis points.
The background of this appreciation phase is:
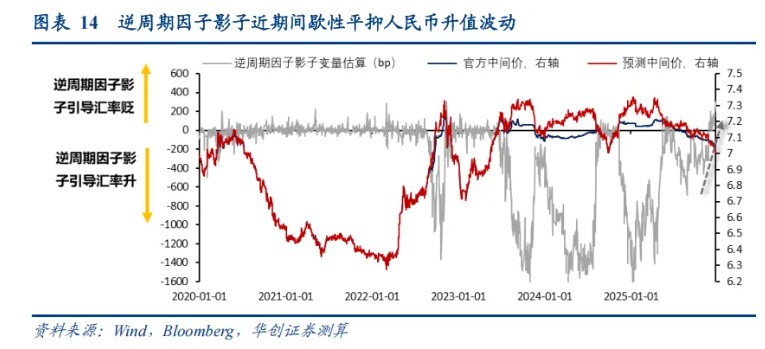
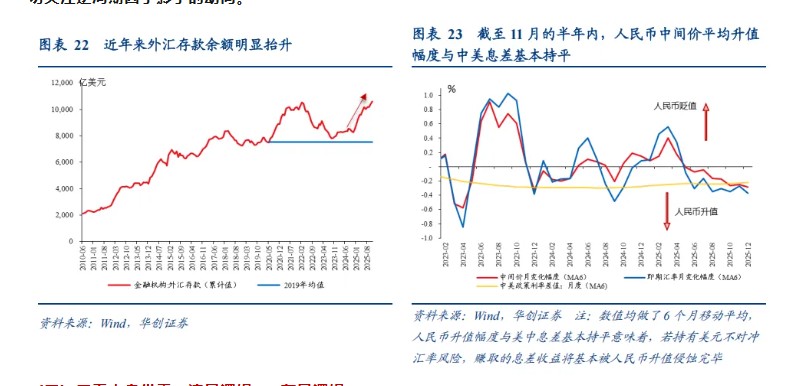
① On the policy level, it may no longer be the guiding force for appreciation but rather aims to stabilize excessive appreciation fluctuations. From the Huachuang macro exchange rate model, it can be observed (Note: Considering the model calculation error, we generally consider the counter-cyclical factor shadow ±100 basis points significant, reflecting a higher probability of policy intervention). From mid-April to November 25 this year, the counter-cyclical factor shadow significantly leaned towards appreciation, averaging around -230 basis points per day; however, since November 26, the appreciation direction of the counter-cyclical factor shadow has no longer been significant, and since December 16, it has turned to a significant continuous depreciation direction (averaging around 192 basis points per day).
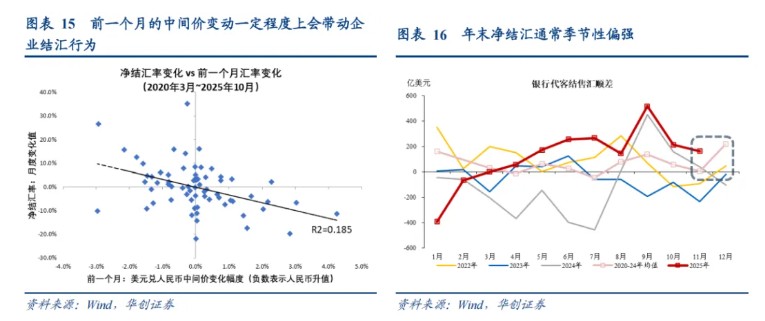
② In terms of domestic supply and demand, the core factor behind it is the settlement and sale of foreign exchange. Currently, the December settlement and sale data has not yet been released, but logically, the appreciation of the RMB itself will affect enterprises' expectations and behaviors regarding foreign exchange settlement. Coupled with the typically strong seasonal characteristics of year-end settlement, these two factors may have jointly driven the strong performance of domestic supply and demand factors in the second phase of appreciation. On one hand, the continuous appreciation of the RMB exchange rate will have a certain impact on enterprises' foreign exchange settlement decision expectations (the changes in the central parity in the previous month can to some extent drive changes in the net settlement rate, as shown in Figure 15); on the other hand, year-end net settlement is usually strong (as shown in Figure 16).
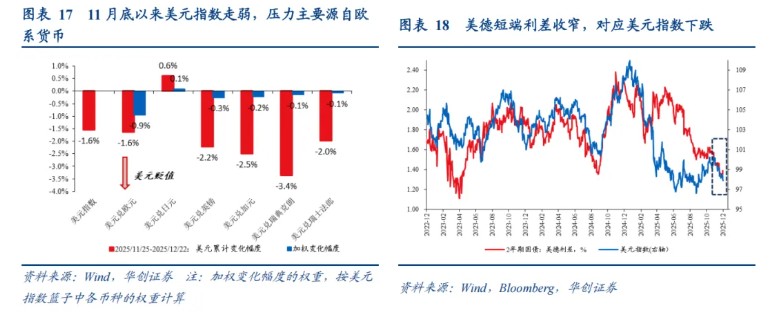
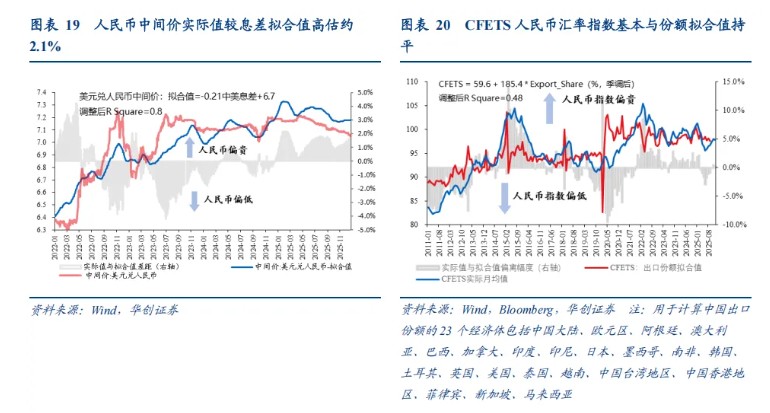
③ In terms of external responses, since the end of November, the US dollar index has fluctuated and declined. The depreciation pressure mainly comes from European currencies (as shown in Figure 17), which is backed by the warming expectations of interest rate cuts by the Federal Reserve, leading to a narrowing of the interest rate differential between the US and Germany (as shown in Figure 18).
4. Future Outlook for the Renminbi Exchange Rate
Based on the review and attribution of this year's Renminbi appreciation, we look ahead to the future exchange rate trends, focusing on four factors:
(1) First, look at the valuation factor: Is the exchange rate expensive or cheap?
The first aspect to consider is the valuation factor; is the current Renminbi exchange rate significantly overvalued or undervalued?
We observe from two perspectives:
-
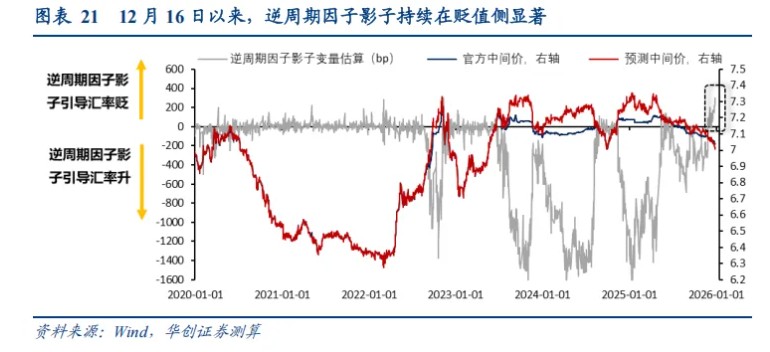
From a single exchange rate perspective, the interest rate differential is closely linked to the USD/CNY midpoint rate, especially after 2022. We fitted the 10Y U.S.-China government bond yield spread (1-month rolling average) and the USD/CNY midpoint rate (1-month rolling average) from January 2022 to November 2025, obtaining the latest fitted midpoint rate based on the interest rate differential at approximately 7.18. The actual midpoint rate of the Renminbi on December 26 was around 7.04, indicating that the actual value of the Renminbi is slightly more expensive than the fitted value by about 2.1%, which falls within a relatively normal fluctuation range. In comparison, before the August 2015 exchange rate reform, the Renminbi was overvalued by more than 5%.
-
From a basket of currencies perspective, the CFETS Renminbi exchange rate index is highly correlated with export share, which points to China's export competitiveness. Looking back at the data, in the second to third quarters of this year, the CFETS index was indeed lower than the fitted value of export share. Despite no significant decline in China's export share, the CFETS index dropped significantly, from a March average of 98.9 to an average of around 95.5-96 in June and July, with the undervaluation at its peak reaching 2.9% compared to the fitted value (Figure 20). However, since the fourth quarter, the CFETS index has shown a "catch-up" effect. Currently, using the latest value of China's export share (seasonally adjusted at 20.5% in September) to fit the CFETS Renminbi exchange rate index gives a value of 97.6, which is basically in line with the average CFETS index of 97.7 from December to now. This indicates that the CFETS index's "catch-up" may have been completed, and the current Renminbi exchange rate index is essentially aligned with the export competitiveness priced by the share.
In summary, whether from the interest rate differential and single exchange rate perspective or from the export competitiveness and basket of currencies perspective, there is no overvaluation/undervaluation issue with the Renminbi, with a deviation from the "value center" of about 0%-2%, which is within a reasonable pricing range.
(2) Second, look at policy orientation: How is the counter-cyclical shadow moving?
The second aspect to consider is the policy direction; is the counter-cyclical factor shadow being utilized, and how is it being utilized?
Currently, it appears that the counter-cyclical factor shadow has shifted from guiding the Renminbi to appreciate steadily to stabilizing excessive appreciation fluctuations, reflecting that the policy aims to maintain stability rather than guide the market to form expectations of a one-sided Renminbi exchange rate trend.
 In addition, looking back, how should we understand the "efforts" of the counter-cyclical factor shadow during the first phase of the appreciation trend? We believe that, apart from the backdrop of China-U.S. trade frictions, there may also be considerations for risk prevention, rather than intentionally guiding the exchange rate to form a one-sided trend. The reasons are as follows:
Firstly, the accumulation of foreign exchange poses a spiral risk of amplified volatility, which needs to be moderately guided to clear. We have elaborated in previous reports that over the past three years, enterprises have had a strong willingness to hold foreign exchange, with a low net settlement rate, driving up the balance of foreign exchange deposits (Figure 22). This constitutes a "quasi-carry trade" for the renminbi, which means that if market volatility triggers a reversal in the exchange rate trend, such funds may also face a risk of forced settlement similar to the unwinding of yen carry trades. Moreover, since the holders are mostly real enterprises, such risks may directly impact corporate profits and affect the real economy.
In this context, considering two factors, policy guidance for a stable appreciation of the exchange rate may help alleviate risks. On one hand, the behavior of enterprises in settling foreign exchange is itself influenced by short-term exchange rate trends (the changes in the middle rate over the previous month can to some extent drive changes in the net settlement rate, Figure 15). A steadily appreciating middle rate under policy support may help guide enterprises to settle foreign exchange moderately. On the other hand, a controllable appreciation of the exchange rate under policy support may moderately hedge the attractiveness of holding foreign exchange brought about by interest rate differentials, which is also conducive to the release and settlement of existing foreign exchange positions. In the past six months, the fluctuations in the renminbi exchange rate have basically offset the interest income from holding U.S. dollar positions (Figure 23).
In contrast, the current renminbi exchange rate has shifted to an appreciation driven mainly by domestic supply and demand, which may indicate that settlement is being released, and attention should be paid to the pace of this release to prevent risks from rapid fluctuations in the exchange rate. This may also explain why the counter-cyclical factor shadow has shifted to stabilize appreciation fluctuations. Future attention should still be closely paid to the trends of the counter-cyclical factor shadow.
(3) Thirdly, looking at domestic supply and demand: flow logic vs stock logic
The third perspective on domestic supply and demand essentially focuses on the fundamental supply and demand for foreign exchange, namely the settlement and sale of foreign exchange.
- Flow logic: Trade surplus (dependent on exports) × net settlement rate (dependent on PMI)
Typically, we focus on flow logic, believing that the current net settlement depends on current foreign exchange income and the willingness of enterprises to settle foreign exchange, with the core ultimately being exports and PMI.
The reason is that the renminbi, as a currency with limited openness in the financial account and a currency of a manufacturing powerhouse, has a very critical current account attribute (the net settlement is mostly dominated by the current account, Figure 24). From a flow perspective, the current account net settlement = trade surplus × net settlement rate, which means that the potential for net settlement depends on the trade surplus, and the core of the trade surplus lies in export competitiveness. The trend of net settlement may depend on the willingness of enterprises to hold foreign exchange, reflected in the net settlement rate (Figure 25). The willingness of enterprises to hold foreign exchange may fluctuate due to interest rate differentials and recent exchange rate fluctuations, but the trend direction depends on PMI (Figure 26) From a historical perspective, the logic of flow is effective, and the RMB exchange rate tends to be retrospective. Before the trend of appreciation begins, there is often an observable improvement in the balance of foreign exchange settlement, with the deficit gradually narrowing to a surplus. This is supported by an upward trend in PMI, which drives the net settlement rate to continue fluctuating upward (Figures 25-26).
Currently, it is expected that the external demand environment next year will remain stable under the support of dual easing in fiscal and monetary policies in Europe and the United States, and exports may maintain resilience. However, the domestic manufacturing PMI is still fluctuating and may still be accumulating momentum for a trend-based recovery (Figure 26).
- Stock Logic: The release of the backlog of pending foreign exchange settlements may amplify appreciation volatility.
It is particularly important to note that in the past three years, China's exports have been generally strong, and the trade surplus has significantly expanded. However, enterprises have a strong willingness to hold foreign exchange, with the settlement rate lower than in the past, which may have formed a large backlog of pending foreign exchange settlements. If this is released, it may have a significant impact on the current net settlement.
In terms of scale, referring to the two estimation methods in our report, since 2022, there may have accumulated around USD 737 billion (calculated using trade surplus - net settlement) to about USD 1.1 trillion (calculated using net foreign receipts from trade - net settlement), with a median of approximately USD 923.7 billion (Note: the estimation is not precise, as there is no historical period to review, and not all of these backlogs may return). In comparison, the average monthly net settlement of the current account in the first 11 months before 2025 is close to USD 20 billion, which means the scale of the backlog of pending foreign exchange settlements is roughly equivalent to 3.5 to 4 years of net settlement accumulation.
Whether the stock of foreign exchange is released is significantly influenced by its exchange rate cost. If the spot USD exchange rate is lower than the cost when enterprises were hoarding foreign exchange, it may cause "paper losses," enhancing the tendency for enterprises to settle. A simple observation of the data shows that "hoarding without settlement" mainly occurred in 2022 and 2024 (Figure 27), during which the central fluctuation of the spot exchange rate was close to 7 (averaging about 6.96), with annual averages of 6.7 and 7.2 respectively. From this perspective, as the spot exchange rate broke through 7.2 in late May this year, the stock of foreign exchange hoarded in 2024 may see some release. Data shows that since May, the difference between net foreign receipts from trade and net settlement has indeed shown a significant convergence. Moving forward, as the spot exchange rate approaches the integer level of 7.0, the stock of foreign exchange hoarded in 2022 may gradually be released, potentially amplifying exchange rate appreciation volatility.
In summary, we believe that the trend of the RMB exchange rate is still determined by the logic of flow, which may still await further accumulation of trend-based recovery momentum in the fundamentals. However, it should be noted that stock logic may amplify volatility. Although the RMB appreciation since May may have prompted some release of the hoarded pending settlement positions, some of the backlog with lower exchange rate costs may be released near the important integer level of 7.0, thereby amplifying exchange rate appreciation volatility, which still requires close attention.
 (4) Observing External Market Response: How is the US Dollar Moving?
The fourth observation of external market response focuses on how to view the US Dollar Index. We believe that, from a fundamental perspective, the current situation is characterized by preventive interest rate cuts, which may provide a bottom for the US economic fundamentals. In the coming year, the US may still have a relative economic growth advantage over Europe and Japan. Additionally, historical analysis shows that after the Federal Reserve cuts interest rates without falling into an economic recession, the dollar tends to be strong initially and then levels off, rather than continuously weakening; combined with trading factors, the current short positions in the dollar index are already quite extreme, making the probability of a sustained weakening of the dollar low.
Specifically:
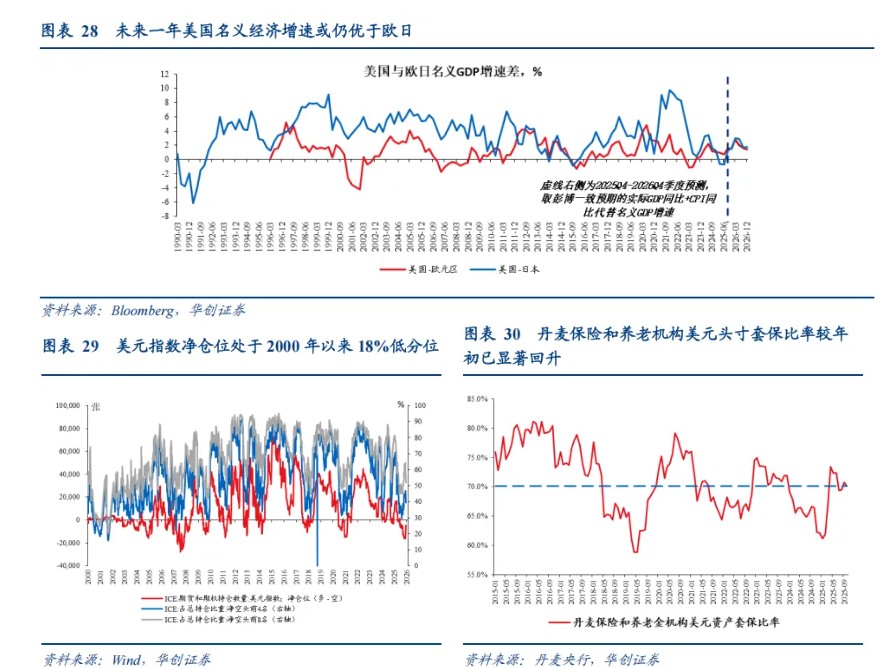
From a fundamental perspective, the "preventive" nature of this round of Fed interest rate cuts is very prominent: the US economy has not entered a recession, and it may still have a relative growth advantage over Europe and Japan in the coming year (Figure 28); the performance of US asset prices is also good, with interest rate cuts providing support, making dollar assets relatively attractive. This means that, from a fundamental viewpoint, the probability of a sustained weakening of the dollar index is low.
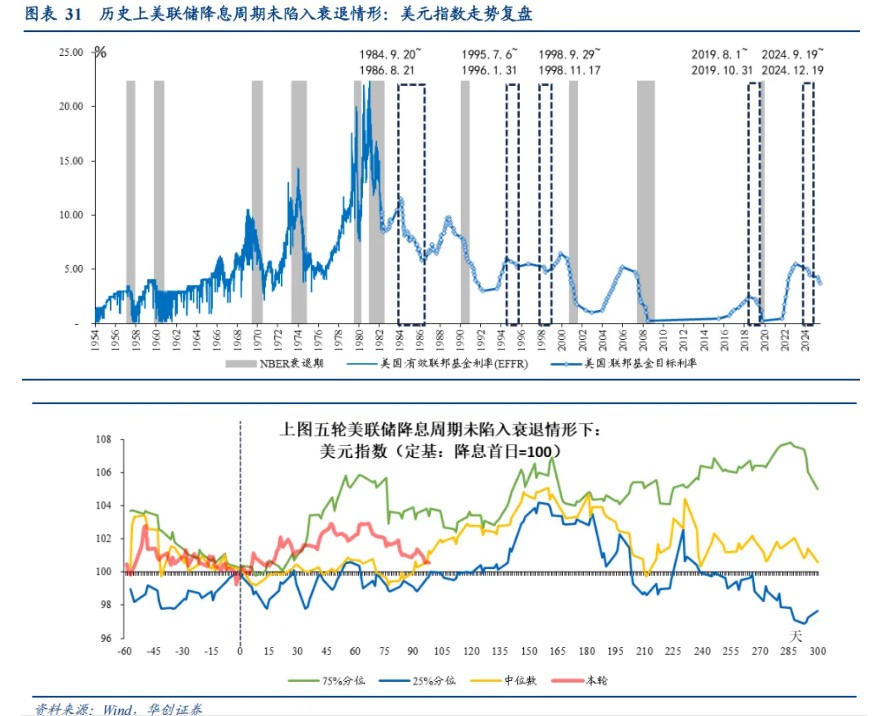
Looking at historical analysis, after the Fed cuts interest rates without falling into an economic recession, the dollar has not continuously weakened but has instead experienced initial fluctuations upward, followed by a correction and then a leveling off (Figure 31).
From a trading perspective, the current short positions in the dollar index are already quite extreme, indicating that the driving forces behind the dollar's weakness may be marginally weakening. Observing two sets of data: first, the net positions and net short concentration of the dollar index, with the former at an 18% low percentile since 2000, and the latter, the proportion of the top four/eight short positions at 16.9%/16% low percentiles since 2000, showing that shorts are very widespread and dispersed (Figure 29); second, the hedging ratio of dollar positions held by insurance and pension institutions, for example, in Denmark, has stabilized around 70% since July, with the latest figure in October at 70.2%, at a 43% percentile level since January 2015, close to the median range (Figure 30).
In summary, from the above four perspectives, looking ahead to future exchange rate trends, we believe that, first, from a valuation factor perspective, there is no issue of overvaluation or undervaluation in exchange rate valuation, and there is no accumulated adjustment pressure. Internally, the RMB exchange rate has a stable foundation under the resilience of exports and policy support, but the fundamental momentum for a significant upward trend may still need further accumulation (PMI trend recovery → net settlement rate trend uplift → RMB trend appreciation); externally, the current situation is characterized by preventive interest rate cuts, and the US may still have a relative economic growth advantage in the coming year, while the current short positions in the dollar index are already quite extreme, limiting the pressure for the dollar to continuously weaken. Therefore, the probability of a significant upward trend in the RMB against the dollar is low. However, considering the RMB appreciation trend since May, it may have prompted enterprises to release some of the accumulated settlement positions, which may widen the fluctuation range that the RMB exchange rate can withstand It should be noted that as the exchange rate approaches important integer levels, the release of remaining backlog foreign exchange positions may still amplify appreciation fluctuations.
Risk Warning and Disclaimer
The market has risks, and investment should be cautious. This article does not constitute personal investment advice and does not take into account the specific investment objectives, financial conditions, or needs of individual users. Users should consider whether any opinions, views, or conclusions in this article are suitable for their specific circumstances. Investment based on this is at one's own risk
