


Meta Earnings Report: 28% growth, why is the free cash flow rate only 1.3%?
Meta's Q2 earnings can be summarized by three numbers: revenue grew 28% year-over-year, capital expenditures amounted to 51.1% of the quarter's revenue, and the free cash flow margin dropped to 1.3%.
The core advertising business maintained double-digit growth in both volume and price, with AI recommendations, ad ranking, and automated bidding tools entering the revenue generation chain; meanwhile, quarterly capex of $31.078 billion nearly depleted the $31.862 billion in operating cash flow. The core of current valuation has shifted to input-output efficiency: whether the incremental profit from the ad system can cover data center depreciation, energy, operations & maintenance, and financing costs.
I. Ad Volume and Price Remain Strong, Profit Margin Enters a Downward Cycle
Meta achieved revenue of $60.801 billion in Q2, up 28% year-over-year; advertising revenue was $59.363 billion, up 27% year-over-year, accounting for 97.6% of total revenue. Daily active users on Family of Apps reached 3.6 billion, up 3% year-over-year; ad impressions grew 14%, and average ad prices increased 12%.
From a volume-price perspective, the 14% growth in impressions and 12% growth in prices basically explain the increase in advertising revenue. User scale growth has slowed to low single digits, so future revenue elasticity will rely more on recommendation efficiency, user time spent, ad inventory expansion, and conversion rate improvements. The maintenance of double-digit growth in ad prices in Q2 indicates that advertiser demand and platform return on ad spend have not significantly loosened.
Profitability weakened significantly compared to revenue. Cost expenses grew 55% year-over-year to $42.026 billion, operating profit decreased 8% year-over-year to $18.775 billion, and the operating profit margin dropped from 43% to 31%. This includes $2.4 billion in legal matters expenses and $1.18 billion in severance costs, totaling $3.58 billion.
One-time items amplified the decline in profit margins, but the rise in structural costs is more concerning. R&D expenses grew approximately 67% year-over-year to $21.656 billion, accounting for 35.6% of revenue; depreciation and amortization were approximately $6.356 billion, up about 46% year-over-year. AI talent, model training, third-party cloud resources, data center operations, and equipment depreciation have become the main sources of cost growth.
Profit Pressure | Duration | Investment Implication |
|---|---|---|
Legal fees, severance costs | Phased | Significant impact on quarterly margins; do not extrapolate directly |
AI talent, depreciation, cloud resources, and data center operations | Medium-to-long term | Continuously impacts operating profit margin and EPS |
Reality Labs losses | Medium-to-long term | Weakens the ability of ad profits to cover AI investments |
Slowing ad impression growth | Continuous observation | Increased reliance of revenue on ad prices and conversion rates |
The advertising business has not entered a contraction phase, but the cost structure has changed. The previous round of margin repair mainly relied on layoffs and expense control; the current cycle requires ad incremental profits to continuously cover server depreciation, model R&D, and infrastructure operations.
II. AI Commercial Returns Have Entered the Ad System
The most certain path for AI monetization at Meta currently lies within the ad system. The company uses large language models for content understanding, user intent recognition, ad retrieval, and ranking, driving advertiser ROI and bid prices by improving match accuracy and conversion rates.
In early Instagram experiments, user preference understanding based on LLMs improved in-app event conversion rates by 1%; after combining Facebook's user understanding model with the GEM ad ranking model, ad clicks increased by 8.3% and conversions rose by 15.7%. The annualized ad revenue run rate for the Advantage+ product suite exceeds $75 billion, with over 9 million small businesses using at least one generative AI ad creative tool.
These figures need to distinguish between stock revenue and incremental contribution. The $75 billion corresponds to ad revenue placed through the Advantage+ system, which includes migration of existing budgets; increases in click-through and conversion rates also come from specific models and test environments and cannot be linearly extrapolated to the entire platform.
Ad Revenue = Ad Inventory × Fill Rate × Average Ad Price
AI recommendations increase user time spent and sellable inventory, ad ranking improves conversion rates, and generative creative tools lower ad production costs. These three capabilities ultimately enter the bidding system, translating into ad budgets, prices, and customer retention. Meta possesses content and commercial behavior data from billions of users, a mature ad bidding system, a vast advertiser base, and complete payment relationships; the certainty of this monetization mechanism is higher than that of general model APIs charged per token.
The current certainty ranking of AI returns is roughly as follows: ad recommendations and ad tools, Business Agents, model APIs and subscriptions, consumer-grade personal Agents, and external compute rental.
III. Capital Expenditures Absorbed 97.5% of Operating Cash Flow
In Q2, Meta's operating cash flow was $31.862 billion, up approximately 25% year-over-year; capital expenditures reached $31.078 billion, up approximately 83% year-over-year, including $30.116 billion in fixed asset purchases and $962 million in finance lease principal payments.
Capital expenditures accounted for 51.1% of operating revenue and absorbed 97.5% of the quarter's operating cash flow. Free cash flow was only $784 million, down approximately 91% year-over-year, with the free cash flow margin dropping to 1.3%. The advertising business still possesses strong cash creation capabilities, but the direction of cash allocation has shifted from buybacks and balance sheet accumulation to servers, data centers, power, network, and finance leases.
The company narrowed its 2026 capital expenditure guidance to $130–145 billion, with a midpoint of $137.5 billion; full-year expense guidance is $165–169 billion. Q3 revenue guidance is $61–64 billion, with the midpoint corresponding to a year-over-year growth rate of approximately 22%, lower than the actual 28% growth in Q2. The slowdown in revenue growth combined with high-level capital expenditure will continue to suppress the free cash flow conversion rate.
Data Center Construction → Increase in Fixed Assets → Rise in Depreciation and O&M → Pressure on Profit Margins → Decline in Free Cash Flow
As of the end of Q2, Meta's cash and marketable securities stood at $90.26 billion, while long-term debt rose to $83.66 billion. The company still possesses strong financing capabilities, but AI infrastructure is shifting from being financed solely by operating cash flow to being jointly borne by operating cash flow, long-term debt, and external infrastructure partnerships.
IV. Similar Large-Scale Investments, Different Revenue Absorption Capacities
Within the same reporting period, the stock price reactions of Microsoft and Meta diverged significantly. The market is currently rewarding not the scale of capital expenditures, but the contract demand behind the investment, revenue growth, and cash flow absorption capacity.
Company | Latest Quarter | Revenue | Capex/Revenue | Free Cash Flow Margin | Main AI Investment Absorbing Business |
|---|---|---|---|---|---|
Meta | 2026Q2 | $60.8 Billion | 51.1% | 1.3% | Ad efficiency; Agent and API yet to be verified |
Microsoft | FY2026Q4 | $90.0 Billion | 45.6% | 21.8% | Azure, Microsoft 365, Copilot |
Alphabet | 2026Q2 | $119.8 Billion | 37.5% | -4.9% | Google Cloud, Search, Workspace |
Amazon* | 2026Q1 | $181.5 Billion | 23.8% | -9.5% | AWS, Ads, and Retail Infrastructure |
* Amazon's Q2 earnings report has not yet been released; 2026Q1 data is used; its capital expenditures cover both AWS and retail logistics systems, and there are differences in accounting standards between companies.
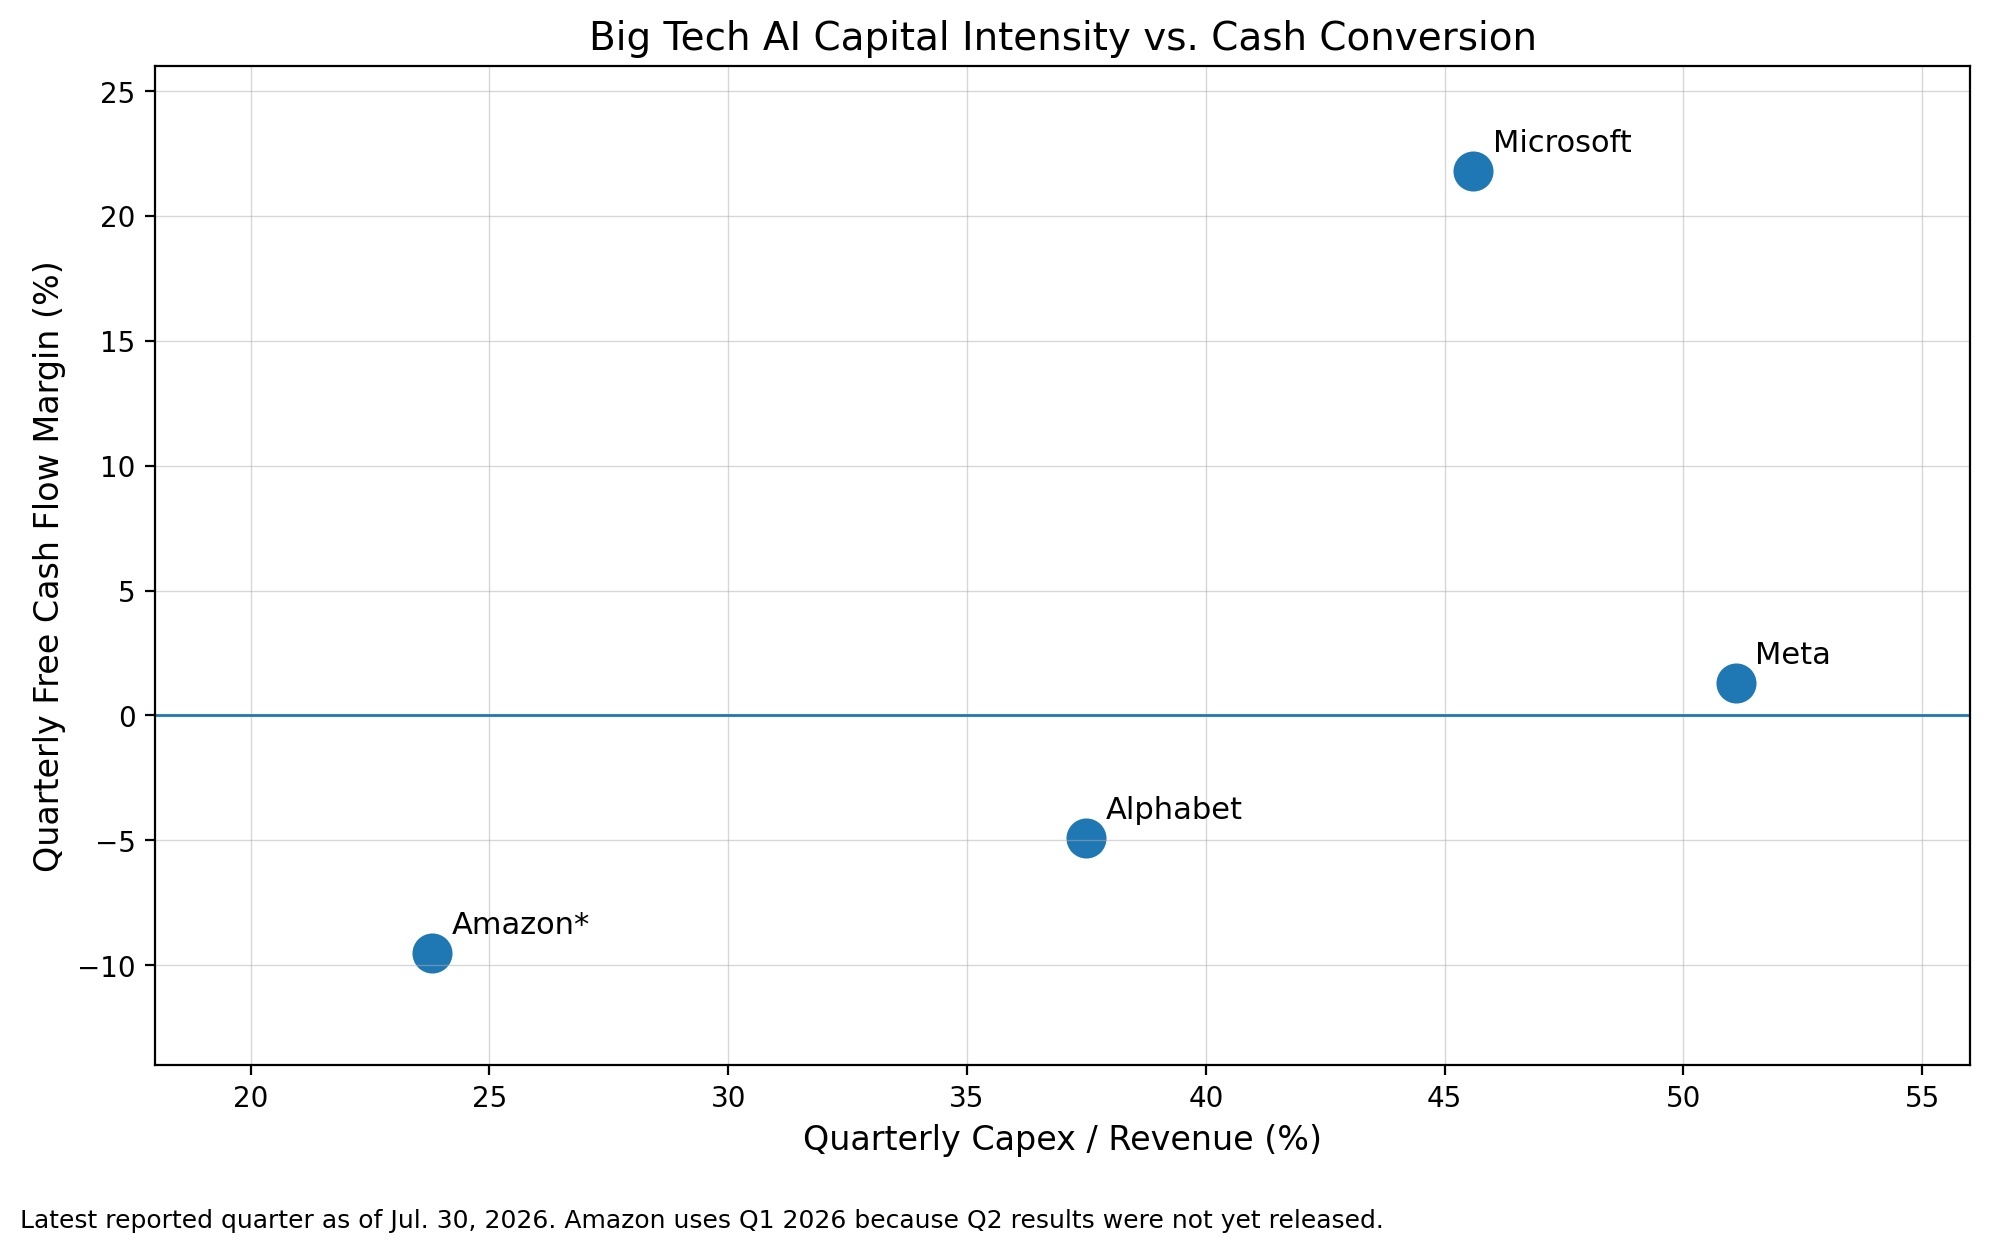
The higher the capital expenditure ratio and the lower the free cash flow ratio, the greater the short-term capital recovery pressure. Meta and Microsoft have similar capital intensity, but their cash conversion capabilities differ by approximately 20 percentage points.
Microsoft's quarterly capital expenditures reached $41 billion, but Azure and other cloud service revenues grew 43%, Microsoft Cloud revenue reached $59.3 billion, and commercial remaining performance obligations reached $678 billion, with quarterly free cash flow still at $19.6 billion. Alphabet's capital expenditures reached $44.9 billion, Google Cloud revenue reached $24.8 billion, up 82% year-over-year, and it possesses an independent revenue, profit, and long-term contract system.
Meta lacks a mature cloud business as a direct absorber for capital expenditures. Its computing power is mainly consumed by ad recommendations, model training, consumer products, and internal workloads. While ad AI has indeed improved revenue efficiency, the market cannot directly observe corresponding revenues, order backlogs, and gross margins as it does for Azure, Google Cloud, or AWS.
V. Business Agents Are Closer to High-Quality Revenue Than General Compute Rental
Meta's enterprise AI commercialization can be divided into three layers. The first layer is Business Agents. The company disclosed that over 1 million enterprises now use related tools weekly via WhatsApp and Messenger to handle inquiries, recommend products, and complete transactions, and are beginning to expand to Instagram. Potential charging methods include subscriptions, pay-per-use, and pay-for-performance.
This model aligns well with Meta's existing advertiser base, business messaging, and payment relationships. Enterprises do not need to rebuild traffic entry points; Agents can directly connect product recommendations, customer service, ordering, and payment. Performance-based charging can also leverage Meta's existing attribution and bidding systems.
The second layer consists of model APIs, developer tools, and enterprise productivity products. This type of business has higher software revenue attributes but requires Meta to bolster enterprise sales, industry delivery, information security, compliance, and technical support capabilities. Models and computing power do not automatically equate to enterprise market share.
The third layer is the direct sale of computing power. Management stated that they have received quotes to purchase computing power at a significant premium, but have not yet disclosed anchor customers, contract volumes, terms, pricing, and revenue recognition schedules. Bloomberg Intelligence estimates that the operating profit margin for Meta's compute services may be 15–20 percentage points lower than its advertising business. Equipment depreciation, power, network, operations, and hardware updates determine the profit margin ceiling for this type of business.
Compute sales can improve equipment utilization and recover some fixed costs, but the valuation attribute remains close to that of capital-intensive infrastructure businesses. Only if Business Agents and model APIs achieve paid scale can they 沉淀 (accumulate) customers, data, and software capabilities, forming a higher-quality independent profit source.
VI. Valuation Is Not Expensive Enough to Be a Bubble, Nor Cheap Enough to Provide Full Protection
Meta's reference Forward PE post-earnings is roughly in the 18–20x range. Microsoft is approximately 22–23x, Alphabet is about 24x, and Amazon is around 28x. Meta trades at a discount relative to some large tech companies, but the magnitude of the discount needs to be judged in conjunction with revenue quality and cash flow visibility.
Company | Reference Forward PE | Valuation Support | Main Constraints |
|---|---|---|---|
Meta | Approx. 18–20x | Ad revenue growth 27%, price growth 12% | FCF margin 1.3%, direct AI revenue lacks scale disclosure |
Microsoft | Approx. 22–23x | Azure growth 43%, high visibility of enterprise contracts | High valuation premium, continued growth in capex |
Alphabet | Approx. 24x | Cloud growth 82%, stable search cash flow | High capex levels, short-term FCF under pressure |
Amazon* | Approx. 28x | AWS growth and AI infrastructure demand | Mixed retail and cloud capex, profit metrics disturbed by investment income |
The profitability quality of Meta's advertising assets remains high, and an expected P/E of 18–20x is not expensive; however, the AI capital burden weakens the protective effect of this valuation. The midpoint of the 2026 capital expenditure guidance reaches $137.5 billion, with rapid expansion of fixed assets; subsequent income statements will still need to absorb new depreciation, power, network, and financing costs. If direct AI revenue fails to reach scale for a long time, the nominal valuation discount may be offset by downward revisions in earnings forecasts.
Valuation Support = Ad Profit Growth − New Depreciation and O&M Costs + Enterprise AI Incremental Profit
If ad prices maintain high-single-digit to double-digit growth, 2027 capital expenditures peak, and Business Agents and APIs generate paid revenue, the current valuation has room for repair; if ad growth slows while capital expenditures continue to rise, an expected P/E of 18–20x may still correspond to a relatively high actual cash flow multiple.
VII. What Needs to Be Verified in the Next Six Months
Time Node | Core Data | Criteria | Valuation Impact |
|---|---|---|---|
2026Q3 Earnings | Ad impressions, ad prices, depreciation growth rate | Whether ad prices can cover expense growth | Determines short-term EPS resilience |
2026Q3–Q4 | Number of paying Business Agents enterprises, ARPU | Shift from usage to actual revenue | Determines enterprise AI valuation attributes |
2026Q4 Earnings | Preliminary 2027 Capex guidance | Growth peaks or continues to rise | Determines FCF repair timeline |
Next Two Quarters | External compute customers, contract terms, and pricing | Formation of anchor customers | Determines equipment utilization |
Next Two Quarters | Depreciation growth rate vs. revenue growth rate | Whether depreciation begins to converge | Determines profit margin inflection point |
Subsequent Capital Allocation | Resumption of stock buybacks | Reappearance of surplus free cash | Reflects management's judgment on the return cycle |
Advertising Assets Retain Quality, AI Capital Returns Yet to Be Verified
Meta's Q2 advertising revenue grew 27%, with ad impressions and average prices growing 14% and 12% respectively; the core business remains in an expansion phase. AI recommendations, ad ranking, and generative creative tools have entered the revenue chain, and these investments possess quantifiable operational returns.
Valuation pressure concentrates on the capital structure. Quarterly capital expenditures reached $31.078 billion, accounting for 51.1% of revenue, nearly depleting operating cash flow; free cash flow was only $784 million, with fixed assets and long-term debt expanding simultaneously. The cash impact of capital expenditures has already materialized, and the transmission of new depreciation and O&M costs to the income statement continues.
Business Agents and model APIs are more worthy tracking revenue outlets. Compute rental can improve server utilization and short-term cash recovery, but its profit margin and valuation attributes are weaker than those of the ad platform and application-layer intelligence.
Judgment: The long-term competitiveness of Meta's advertising assets has not suffered substantive damage, and short-term earnings forecasts remain constrained by capital expenditure and depreciation cycles. The current pullback has improved trading odds, but mid-term allocation value awaits the restoration of free cash flow and the realization of enterprise AI revenue.
Bear markets do not automatically create value, but they compress valuation premiums lacking cash flow support. For Meta, capital expenditures peaking, depreciation growth lagging behind revenue growth, and enterprise AI revenue beginning to cover new capital costs constitute the financial foundation for mid-term pricing to resume upward movement.
Data Sources and Definitions
Meta, Microsoft, Alphabet, and Amazon company announcements and earnings calls; Bloomberg Intelligence. Differences exist in definitions of capital expenditures, finance leases, and free cash flow between companies; horizontal comparisons are primarily used to observe capital intensity and cash conversion direction.
This article is for company and industry research discussion only and does not constitute any investment advice.
The copyright of this article belongs to the original author/organization.
The views expressed herein are solely those of the author and do not reflect the stance of the platform. The content is intended for investment reference purposes only and shall not be considered as investment advice. Please contact us if you have any questions or suggestions regarding the content services provided by the platform.
