


 Likes Received
 Posts
PostsAll bullish positions were bought in, yet the stock is in a downtrend, while sellers collected 6.52 million.
The Federal Reserve held interest rates steady for the fifth consecutive time, yet unusually saw three officials advocate for a rate hike—the Dow plunged 1,153 points that day, marking its largest single-day drop since April last year, with chip stocks wiping out $1 trillion in market cap in one day. Among 195 unusual trades, the long-to-short ratio was 1.3:1 with longs totaling $62.76 million, but this ratio holds little reference value today: the vast majority of bullish orders were bought during the downtrend and got trapped by the close. Only one trade truly stood firm, and it was from the seller side.
━━━━━━
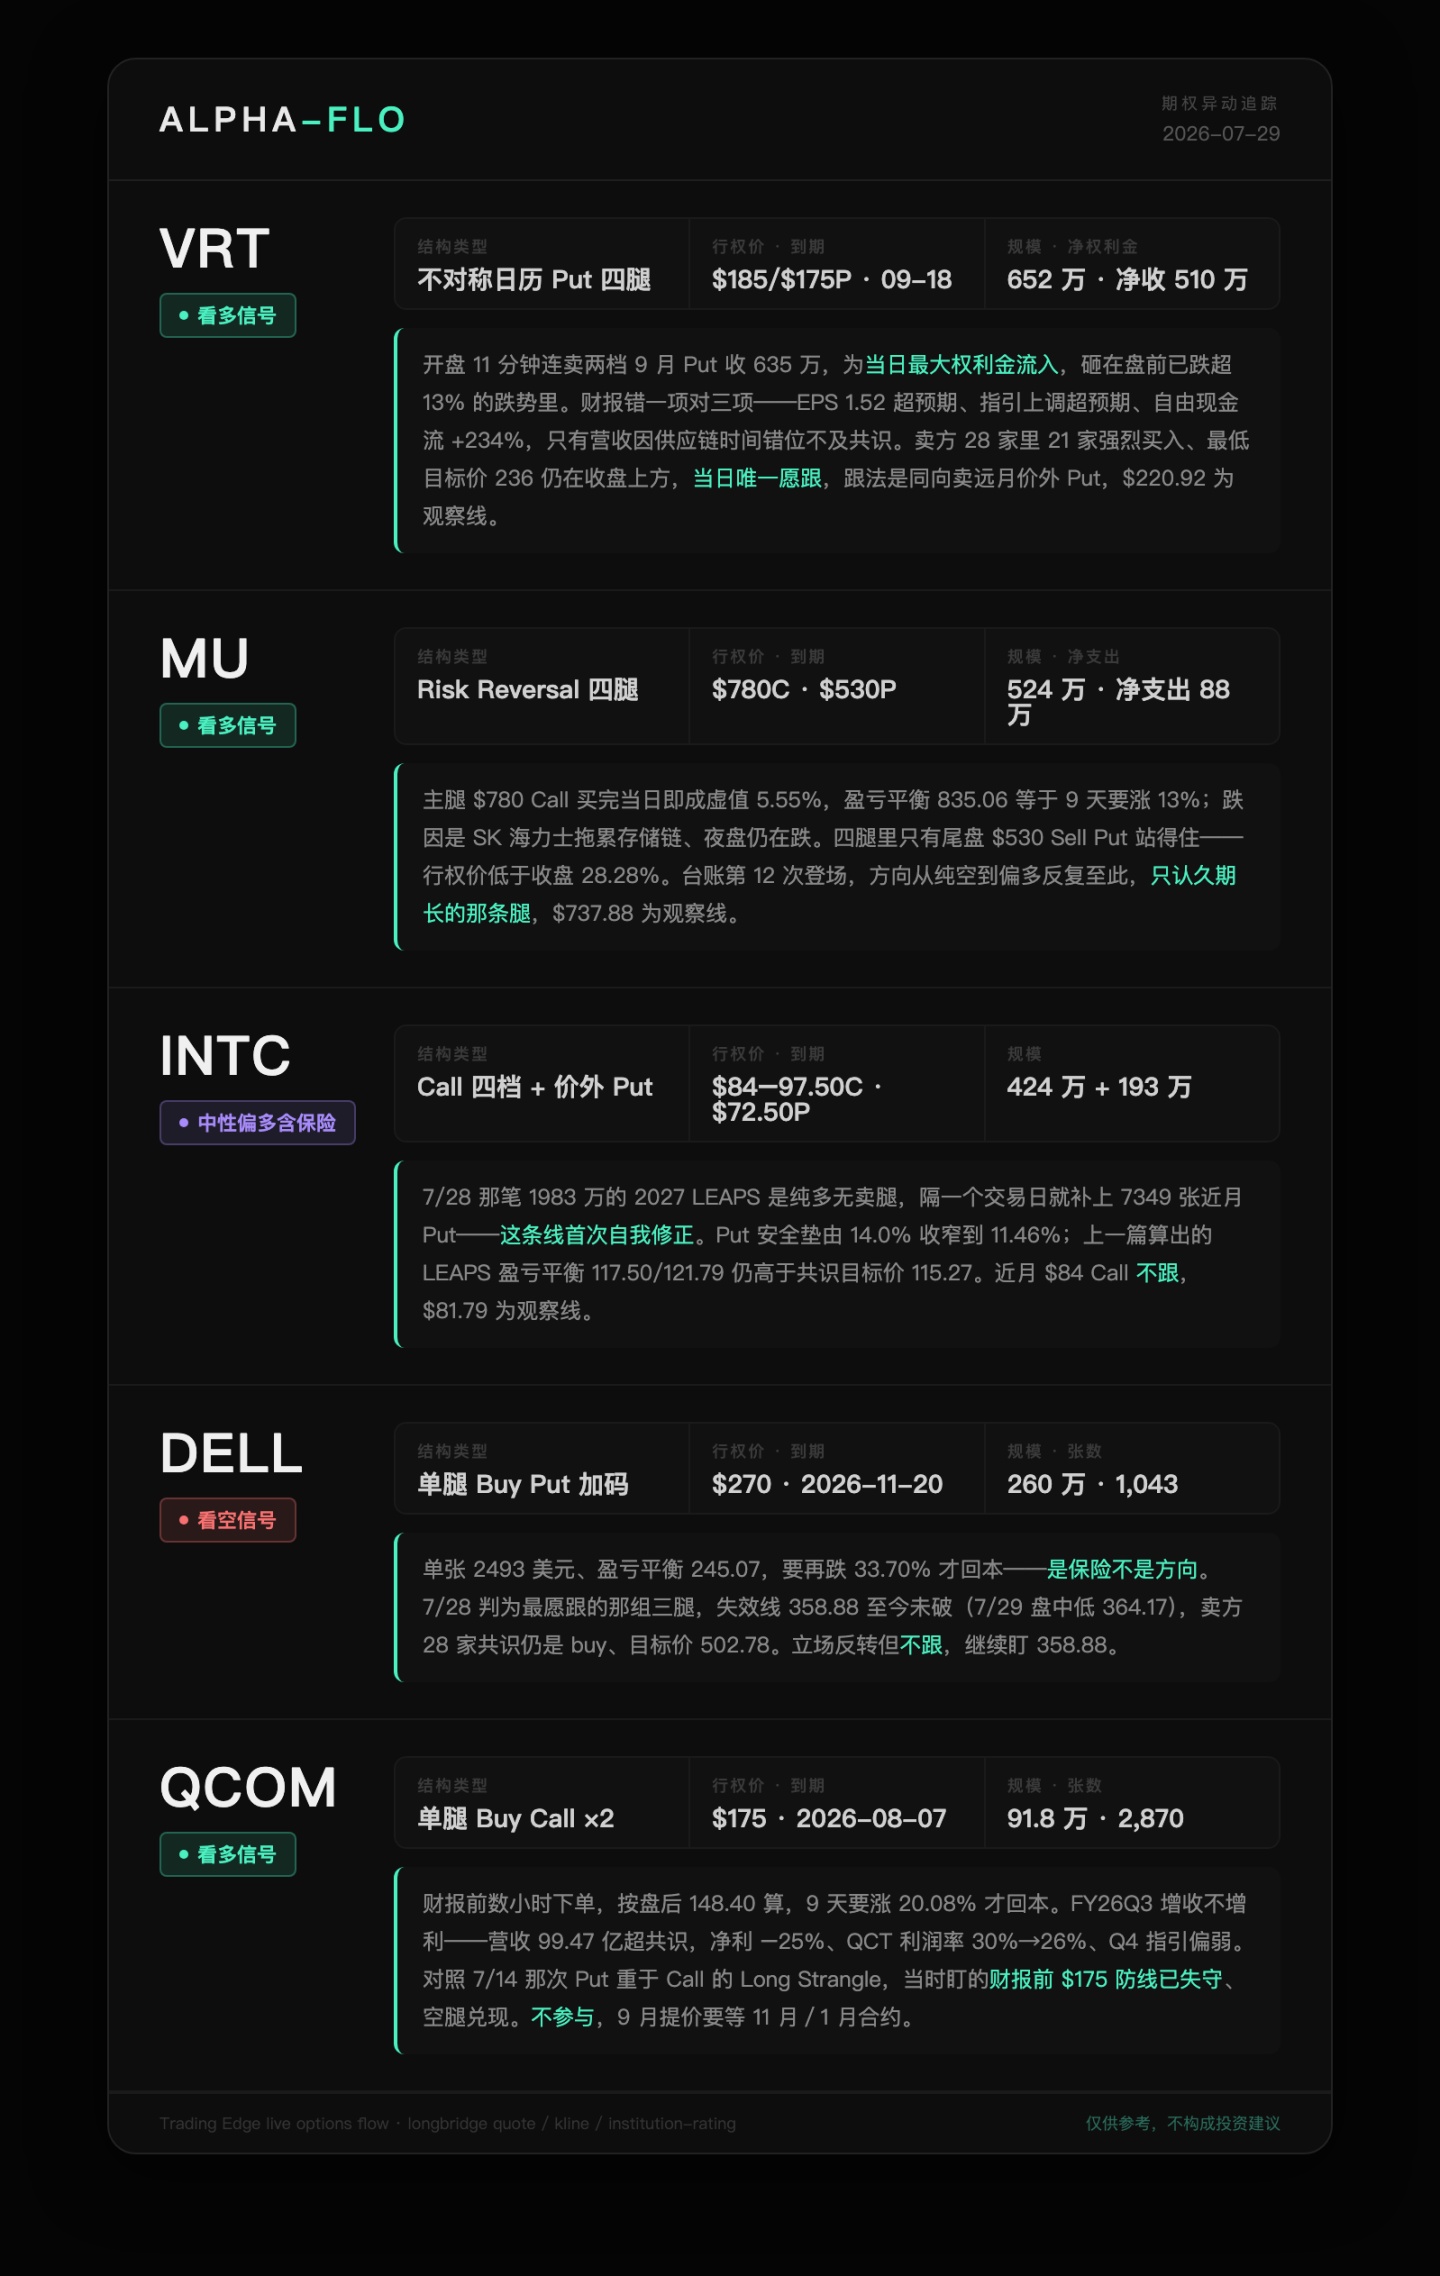
$Vertiv(VRT.US) Vertiv
Direction: 🟢 Bullish
Expiration: 2026-09-18 (Main legs two strikes) · 2026-08-14 · 2026-11-20
Strike Prices: $185 / $175 (Sell Put) · $165 (Buy Put)
Notional Size: Seller receives $6.52M / Buyer pays $1.42M, net receipt approx. $5.1M USD
Volume: 7,000 contracts + 6,475 contracts + 946 contracts + 1,500 contracts
Structure Type: Asymmetric Calendar Put Structure (Three sells, one buy, four legs)
Data Highlights: In the first 11 minutes of trading, two consecutive sell orders for September expiring $175 and $185 Puts brought in $6.35 million, the largest premium inflow on the entire market that day; an hour later, another order for November expiring $165 Buy Put cost $1.42 million. The total notional size of the three Sell Put positions to take delivery is $260.3 million, with the $185 strike alone accounting for $129.5 million. The timing of the sale is critical: Vertiv had already dropped over 13% pre-market on July 29 due to earnings; selling Puts here means dumping into the downtrend, not after it. Closing at 223.04 (−17.25%), with an intraday low of 220.92, setting a new low since March 31.
Bull Case Comparison: The earnings report itself was "one miss, three beats". Adjusted EPS of $1.52 beat expectations of $1.42; Revenue of $3.274 billion missed consensus estimates of $3.377 billion, attributed by the company to temporary supply chain constraints and timing misalignments in multi-phase project execution; Adjusted operating profit of $738 million increased 51% YoY, with margins expanding 410 basis points to 22.6%; Operating cash flow of $1.1 billion and adjusted free cash flow of $925 million surged 241% and 234% respectively; Full-year adjusted EPS guidance raised from $6.30–6.40 to $6.65–6.75, higher than analyst expectations of $6.48. The direct cause of the 17% drop was that the upward revision didn't meet market appetite. Seller consensus updated on July 29: among 28 firms, 21 have strong buy ratings, consensus is strong buy, target price $374.23, even the lowest target of $236 remains above the closing price. Options sellers, earnings quality, and seller consensus are all aligned.
My View: This is the only trade I'm willing to follow today. The $185 strike has a unit price of $6.01, resulting in an exercise cost of $178.99, leaving a 19.75% buffer relative to the close—in other words, the seller's stance is "if Vertiv drops another 20%, I'll still take delivery", while it has already fallen 26.75% from $304.50. I don't accept the pricing of this sell-off: what was missed was revenue with time attributes, while profits and cash flow beat expectations; these two types of quality are unequal. I lean towards the seller's side, following by selling far-out-of-the-money puts rather than buying calls. $220.92 is my observation line; if broken, the 17% buffer for the $185 strike needs recalculating, logic unchanged but position size reduced.
Source: Trading Edge live options flow (Locally collected 2026-07-29)
━━━━━━
$Micron Tech(MU.US) Micron Technology
Direction: 🟢 Bullish
Expiration: 2026-08-07 · 2026-08-03 · 2026-10-16
Strike Prices: $780 / $770 (Buy Call) · $530 (Sell Put) · $745 (Buy Put)
Notional Size: Four legs total approx. $5.24 million, net expense approx. $880k
Volume: 494 contracts + 70 contracts + 720 contracts + 51 contracts
Structure Type: Risk Reversal + Calendar Spread Buy Call + Small Put Hedge (Four legs)
Data Highlights: The main leg was the $780 Call at 13:06, $2.72 million, 494 contracts, placed almost at-the-money, expiring in 9 days. The problem is the daily close was 739.00 (−9.93%), intraday low 737.88—this purchase became 5.5% out-of-the-money, unit price $55.06/share, $5,506 per contract, breakeven at 835.06, meaning it needs to rise 13.00% within 9 days. The reason for the drop isn't Micron itself: SK Hynix's profit growth missed expectations and announced expanded capital expenditures, dragging down the entire storage chain; night market storage chips continued to fall broadly, with Micron dropping nearly 3% again. Among the four legs, the only one that wasn't proven wrong was the late-session $530 Sell Put, receiving $2.18 million, 720 contracts, notional delivery size $38.16 million.
Bull Case Comparison: Sellers show the least divergence on Micron across the market—among 46 firms, 31 have strong buy ratings, consensus is strong buy, target price $1,507.38, more than double the closing price, target range $361 to $2,200. Near-term option flows align with sellers, but stock price fell from 970.82 to 739.00 over seven trading days, cumulative −23.88%; among the three factors, only the stock price moved against them.
My View: I won't follow the two near-term Call strikes. A 13% gain in 9 days is expensive itself, plus the storage chain is still falling overnight; the $780 strike is now racing external headwinds, not fundamentals. I want to isolate the $530 leg: the strike is pressed 28.28% below the closing price, exercise cost $499.72; this is the only expression among the four legs that still holds up in a crash. In my ledger, the Micron line has been written about 12 times—nine consecutive pure short rounds starting from 5/27, first turning long on 7/22, switching to hedge confrontation on 7/23, back to pure short on 7/24, and leaning long again this round. With direction flipping to this extent, I only trust the long-duration leg. $737.88 is the observation line.
Source: Trading Edge live options flow (Locally collected 2026-07-29)
━━━━━━
$Intel(INTC.US) Intel
Direction: 🔵 Hedging / Leaning Long with Insurance
Expiration: 2026-08-07 / 2026-08-10 / 2026-08-21 / 2026-08-28 (Call four strikes) · 2026-08-21 (Put)
Strike Prices: $84 / $90 / $97.50 / $90 (Buy Call) · $72.50 (Buy Put)
Notional Size: Call four legs total approx. $4.238M / Put approx. $1.93M USD
Volume: 5,901 contracts + 892 contracts + 900 contracts + 1,499 contracts + 7,349 contracts
Structure Type: Cross-strike Calendar Spread Buy Call four legs + Out-of-the-money Put (Five legs, full net expense)
Data Highlights: The Call side stretches from the at-the-money $84 all the way to the 17.4% out-of-the-money $97.50 at order placement, spanning four August expiration dates, heaviest being the 11:15 $84 order, $2.83 million, 5,901 contracts. But at 10:33 there was another order for 7,349 contracts of $72.50 Buy Put, $1.93 million, premium close to half of the Call side. Close 81.88 (−5.12%), intraday low 81.79, setting a new low for nearly 3 months. $84 Call unit price $4.80, breakeven 88.80, needs 8.45% rise; $72.50 Put unit price $2.63, breakeven 69.87, Put safety cushion narrowed from 14.0% at order placement to 11.46%. Another rare news item that day: Intel opened partial Atom processor technology, including RTL code, to Rosaic Labs, a startup co-founded by Chen Lizhu's co-investors.
Bull Case Comparison: Sellers remain the most bearish on Intel in the field—among 52 firms, 31 hold, consensus is hold, target price $115.27, with 2 sell ratings and 1 downgrade, target range $74 to $200. Under the news narrative, Intel has fallen 40% since June, while most analysts remain cautious. Option flows lean long, going against seller consensus.
My View: For this trade, I'm looking not at direction, but at stance change. In my ledger, Intel is the third time I've written about it—the 7/23 three-leg combination was validated by Q2 earnings, upgraded on 7/28 to a $19.83 million 2027 same-strike calendar LEAPS, integer lots with no sell legs, pure long; a single trading day later, 7,349 near-month Puts were added, the first self-correction on this line. I calculated earlier that the breakevens for the two LEAPS on 7/28 were 117.50 and 121.79, both higher than the consensus target of 115.27; after another 5.12% drop today, this gap will only widen—the long side indeed needs a layer of insurance. I won't follow the near-month $84 Call, 9 days to expiry plus 2.6% out-of-the-money; the Put leg is actually what should be recorded today. $81.79 is the observation line.
Source: Trading Edge live options flow (Locally collected 2026-07-29)
━━━━━━
$Dell Tech(DELL.US) Dell Technologies
Direction: 🔴 Bearish
Expiration: 2026-11-20
Strike Price: $270
Notional Size: Approx. $2.6 million
Volume: 1,043 contracts (Two same-strike adds at 12:08 / 12:21)
Structure Type: Single Leg Buy Put (Split adds, DTE114)
Data Highlights: Unit price $24.93/share, $2,493 per contract, breakeven 245.07—calculated from close 369.64, the underlying stock needs to fall another 33.70% for this to break even. Close −5.72%, intraday low 364.17; combined with 7/28's −8.15% (intraday low 358.88), cumulative −13.41% over two trading days. The reason for the drop is continuous: concerns over AI server business margins; Citigroup's upgrade of the target price on 7/29 couldn't suppress worries about profitability. Another reverse news item on the same day: SK Hynix stated customers are paying cash to lock in future chip supplies, while Dell just signed a five-year AI agreement.
Bull Case Comparison: Sellers barely moved—among 28 firms, 14 strong buy, 5 buy, consensus buy, target price $502.78, target range $360 to $700, even the lowest tier of $360 clings near the closing price. This option trade goes completely opposite to seller consensus.
My View: Stance reversed, but I won't follow this Put. I wrote about Dell's three-leg Risk Reversal on 7/28—buying $380 Call, selling $385 Put to collect $1.78M, then adding $420 Call, net receipt approx. $900k, bought in the panic zone at intraday low 358.88; I judged it as "the most followable trade" at the time, drawing invalidation line at 358.88. On 7/29 intraday low 364.17, that line hasn't broken, so I don't think we need to flip short now. And this November $270 Put's attribute isn't direction: DTE114, single contract $2,493, needs a 33% drop to break even; this is insurance bought for long positions, separate from "bearish on Dell". I continue watching 358.88; only when broken do I recalculate the three-leg setup.
Source: Trading Edge live options flow (Locally collected 2026-07-29)
━━━━━━
$Qualcomm(QCOM.US) Qualcomm
Direction: 🟢 Bullish
Expiration: 2026-08-07
Strike Price: $175
Notional Size: Approx. $918k USD
Volume: 2,870 contracts (Two same-minute orders at 12:19 / 12:20)
Structure Type: Single Leg Buy Call (DTE9, placed hours before earnings)
Data Highlights: Unit price $3.20/share, $320 per contract, breakeven 178.20. At order placement underlying approx. 159, close 155.68 (−4.42%); earnings released after market close, stock fell another 4.67% to 148.40, night market 151.37. Calculated from after-hours price, this 9-day Call needs the underlying to rise 20.08% to break even. FY26Q3 accounts were "revenue up, profit down": Revenue $9.947 billion, +4% YoY, beating LSEG consensus of $9.67B and hitting company guidance upper bound; but net profit $2.002 billion, −25% YoY, diluted EPS 1.87; QCT segment pre-tax margin dropped from 30% to 26%, QTL from 71% to 69%, cost pressures from wafers, assembly, testing, advanced packaging, and storage. Q4 earnings guidance below expectations, Apple modem revenue decline accelerating, Apple orders halving quarter-on-quarter next quarter. Company notified customers on 7/24 that prices for all chip series will increase by double-digit percentages starting September 1.
Bull Case Comparison: Sellers weren't long to begin with—among 37 firms, 21 hold, consensus hold, target price $220.57, with 1 sell rating and 2 downgrades, target range $100 to $314. This Call trade doesn't match seller consensus nor does it match earnings numbers.
My View: Public earnings gamble, bet on the wrong direction, I won't participate. Here I must mention the ledger: on 7/14 I wrote about Qualcomm's Long Strangle—$190 Buy Call $2.07M paired with $175 Buy Put $3.33M, Put bet 60% more than Call; I characterized it as "volatility structure leaning bearish, not neutral", conclusion was "watch and can follow short leg", closing original words were watching "whether Qualcomm's $175 defense line holds before earnings". The answer is already out: $175 didn't hold, close 155.68, after-hours 148.40; that 8/21 expiring $175 Put unit price $12.66, breakeven 162.34, now in-the-money 19.32 to 26.60, short leg realized. Same $175, two weeks ago someone bought Put, I said follow short leg; today someone buys Call before earnings, price already 12% below it. September price hike is a real variable, but that only matters for November or January contracts after IV falls; don't touch this near-month one.
Source: Trading Edge live options flow (Locally collected 2026-07-29)
━━━━━━
The next node is tonight at 20:30 Beijing Time: Core PCE Price Index, Q2 GDP Initial Estimate, and Initial Jobless Claims all land simultaneously. Whether the Fed, which just cast 3 votes against hiking rates, gets slapped by data will determine whether Vertiv's $260 million delivery commitment is collecting rent or catching a falling knife; watch Micron at 737.88 on the storage chain side, watch Dell at 358.88 on the AI hardware side, that invalidation line I haven't withdrawn yet.
The copyright of this article belongs to the original author/organization.
The views expressed herein are solely those of the author and do not reflect the stance of the platform. The content is intended for investment reference purposes only and shall not be considered as investment advice. Please contact us if you have any questions or suggestions regarding the content services provided by the platform.
