


Euro's bullish candle breaks the downtrend; S&P Strongly penetrates the low point line
S&P 500 Index (US500) – Triple Headwinds Converge, Strongly Piercing Key Support Line
On the daily chart, US stocks suffered a triple blow from the collapse of the US-Iran ceasefire, a split in the Federal Reserve's hawkish stance, and the crumbling of AI faith, with all three major indices performing poorly. The S&P 500 strongly broke below the support line formed by the two swing lows in June, causing the market structure to deteriorate rapidly. Currently, the area between the June 26 low of 7290 and the May 19 low of 7340 is slowing down the selling pressure. If this level is lost, the downside will directly face the June valley bottom of 7225. This latter level is also the lower bound of the range since entering high-level volatility in May; losing it would likely confirm a 阶段性 top. Following that, the reverse 1.618 extension level at 7170 from last November's correction offers mild support. A break below that would probe into a large point-value vacuum zone above January's highs. Conversely, regarding short-term stop-loss opportunities, the double low of early July at 7415 is expected to have heavy selling pressure. This is a necessary condition for the index to fill the overnight medium-yin body and stabilize the market. To challenge the dense high levels of the past two months again, sufficient accumulation may be required. Oscillators have all slipped into weak zones, and the bulls' mid-term advantage has been completely exhausted.
Resistance Reference: 7415, 7520, 7575
Support Reference: 7290, 7225, 7170
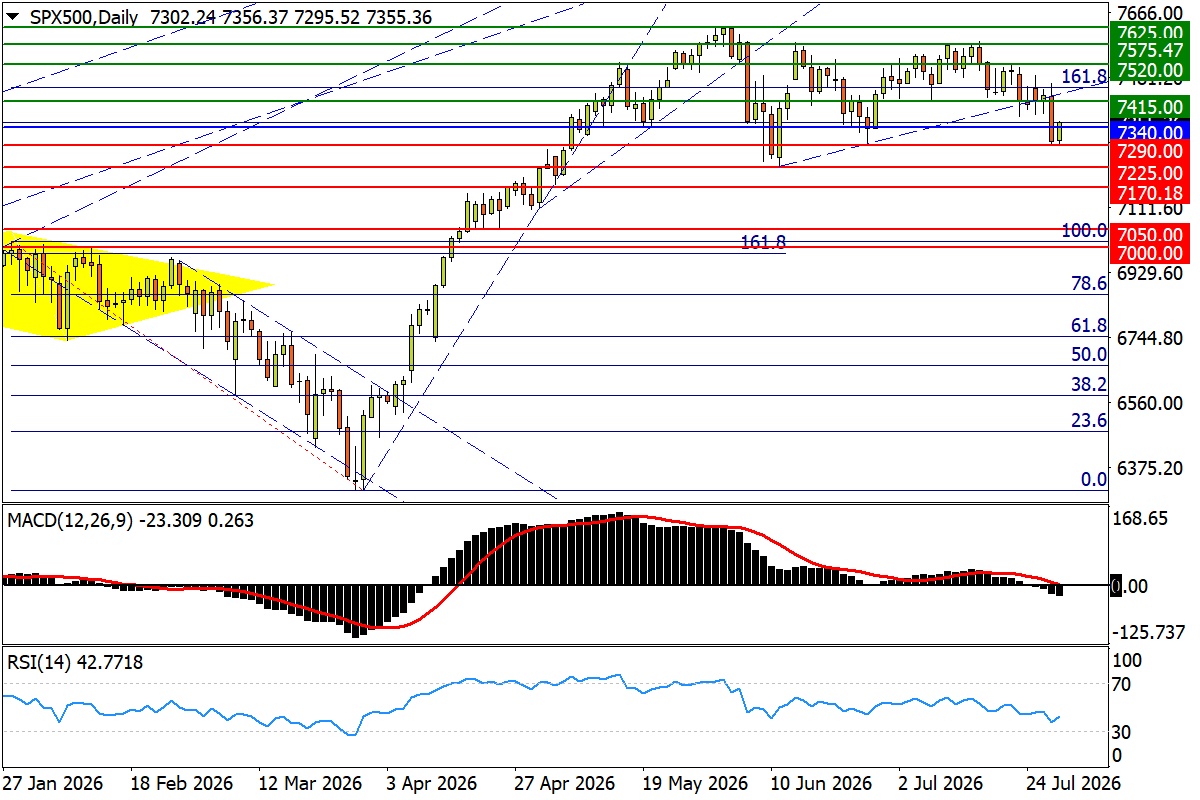
*US500 H4 Source: FXTM
Crude Oil (Crude) – Long Bull Candle Reverses Three Consecutive Bearish Candles, Watch High-Risk Gap Zone
On the daily chart, renewed mutual attacks between the US and Iran led to the collapse of the ceasefire, causing oil prices to surge significantly, reversing the three consecutive bearish candles formed by the brief ceasefire. The drop in US oil inventories to an 8-year low also provided support for the market recovery. Although the steep upward trend at the beginning of July was broken, the back-and-forth tug-of-war in the market creates the possibility of forming higher swing lows. In terms of price points, as long as crude oil further recovers the double low of March 23 and June 9 at 84.80, and the May 6 low resistance zone at 86.70, it can reshape the opportunity to challenge this month's previous high. Regarding indicators, MACD temporarily avoids a death cross above the zero axis; RSI dropped to the neutral zone and then turned upward, with adjustment pressure significantly easing in recent days.
On the 4-hour chart, crude oil's significant overnight rebound reversed the selling rhythm during the three consecutive bearish candles. For the bulls, the key is to withstand the concentrated emergence of potential selling pressure in the weekly gap section below 86.70, avoiding the premature appearance of "lower highs" in the short-term swing. On the downside risk, if the 38.2% retracement level of the long-term uptrend from 2020-2022 at 81.85 is broken, bears may regain control of the market direction. Approaching the April low of 79.00 would also completely erode the bulls' confidence in counterattack. Subsequent support can reference the March 10 volatile low of 75.85. The indicator's previous weak posture has clearly repaired: MACD formed a golden cross below the zero axis; RSI reached the strong side of the neutral zone.
Resistance Reference: 84.80, 86.70, 90.00
Support Reference: 81.85, 79.00, 75.85
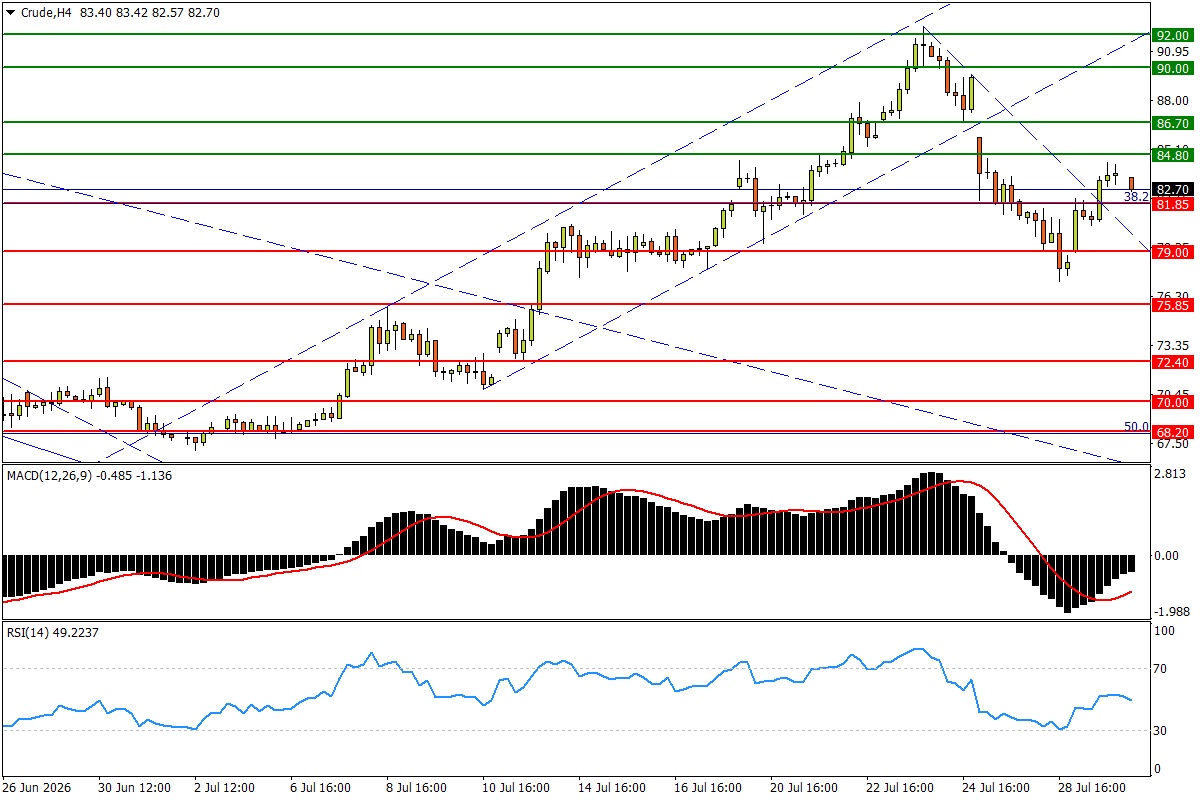
*Crude H4 Source: FXTM
Euro/Dollar (EUR/USD) – Medium Bull Candle Breaks Downtrend, Will Test Box Top Hardness
On the daily chart, because the forex market paid more attention to Walsh's wording at the press conference saying "intent to delay rate hikes," non-US currencies unexpectedly rallied collectively. EUR/USD surpassed the upper rail of the downtrend since mid-May, bursting with strong upward momentum. The bulls instantly arrived at the resistance zone around the mid-term low node of November last year at 1.1465 to this month's high. If it further breaks above the double low of early June at the 1.1500 threshold, the fluctuation box since mid-June can be confirmed as broken upwards. Regarding indicators, after avoiding a death cross below the zero axis, the MACD fast line is closer to the zero axis; RSI rose first into the strong zone, indicating that the market has completely reversed from a dangerous downturn.
On the 4-hour chart, EUR/USD shot up like a mushroom at the end of the US trading session, breaking the previous sluggish posture of slowly probing down along the upper rail of the aforementioned downtrend; currently, the exchange rate is briefly pausing near the aforementioned 1.1465 resistance. On the downside risk, if the potential pullback comes below the double low of late March at 1.1442, bulls will find it difficult to 摆脱 the traction of the recent low-range box immediately. If it subsequently breaks below the March low node of 1.1410, and the August last year valley bottom of 1.1390, it means the logic behind the current Euro rally may be broken by new fundamental developments. Indicators showed divergence under violent fluctuations; the MACD signal line is still below the zero axis, but RSI has risen straight up approaching the overbought line.
Resistance Reference: 1.1465, 1.1500, 1.1540
Support Reference: 1.1442, 1.1410, 1.1390
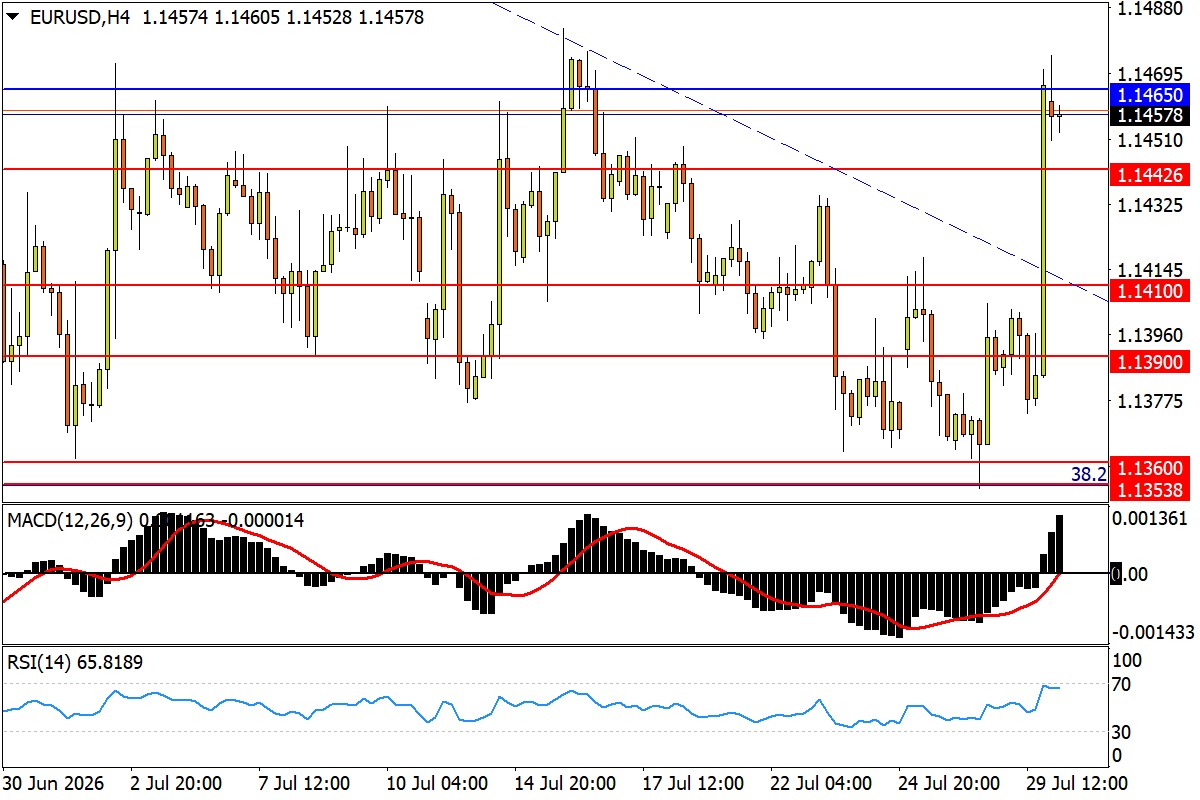
* Euro/Dollar 4-Hour Chart
US Dollar/Canadian Dollar (USD/CAD) – Swing Secondary Low Shows Medium Yin, Downward Turning Point Suspected to Appear
On the daily chart, based on the same interest rate outlook expectations, USD/CAD also interrupted its rebound pace of over a week. As previously hinted in the column, for the bulls, the most "taboo" thing is forming a downward turning point at the secondary low of the swing during the rebound. In terms of price points, the immediate contest is focusing on the high-level node of late October last year around 1.4040, along with the 38.2% retracement level of the February-June 2025 downtrend below at 1.4015 (also last May's high). A break below is a signal for the exchange rate to accelerate its slide. Regarding indicators, after missing a golden cross, the MACD fast line crossed below the zero axis; RSI encountered resistance at the neutral zone and then showed a downward turning point again, indicating secondary pressure on the exchange rate.
On the 4-hour chart, the significant overnight sinking of USD/CAD established the pressure of the connection line between the two obvious swing highs of this month. Before potential counterattacks once again challenge this top edge, last October's high of 1.4080 and last November's mid-month high around 1.4100 will emerge with selling pressure first. Only by recovering both (simultaneously filling the overnight medium-yin body) can the tendency of the exchange rate weakening be completely reversed; upward targets are last November's high of 1.4140, and the 50% retracement level of the aforementioned downtrend at 1.4165, among other resistances. Regarding indicators, the MACD fast line accelerated to cross below the zero axis first; RSI slid approaching the oversold line, highlighting the sharp amplification of downward pressure on the exchange rate.
Resistance Reference: 1.4080, 1.4100, 1.4140
Support Reference: 1.4040, 1.4015, 1.3985
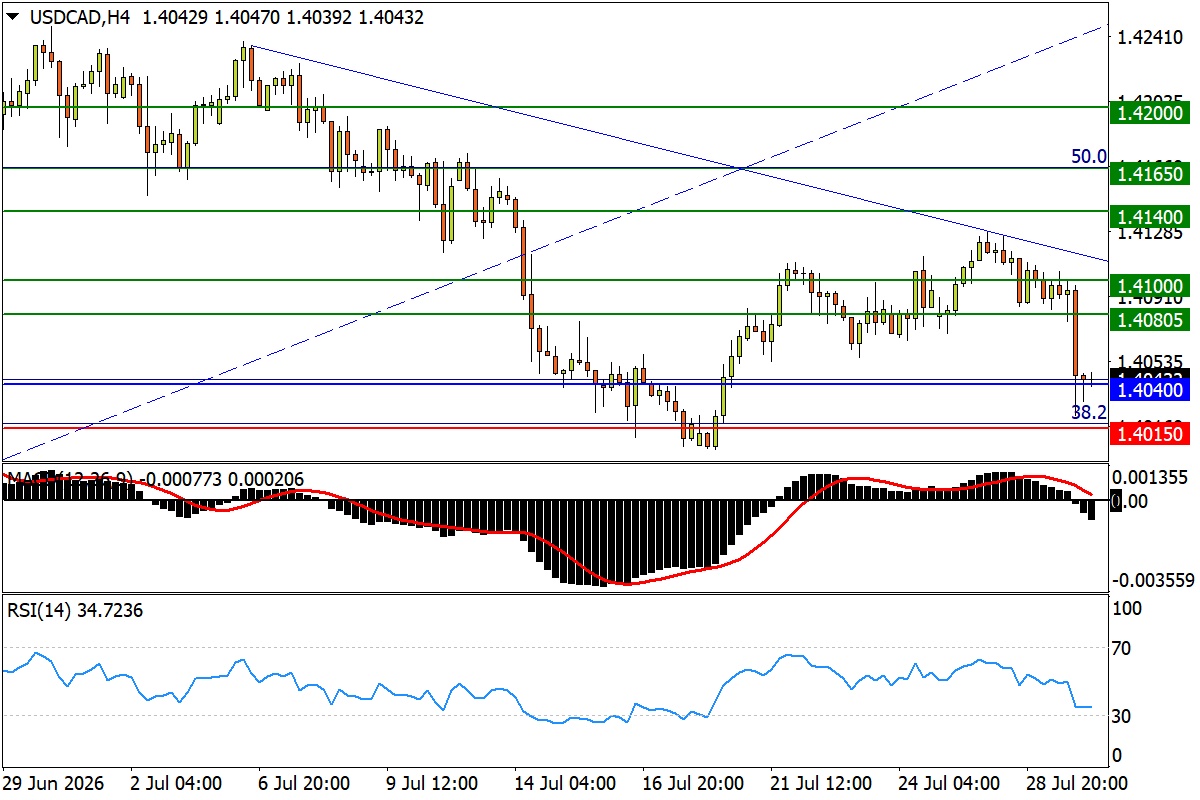
* US Dollar/Canadian Dollar 4-Hour Chart
Gold/Dollar (XAU/USD) – 4000 Support Repeatedly Consolidated, Low-Level Volatility Mode Continues
On the daily chart, although the FOMC decision had three votes suggesting a rate hike, the market's pricing for future Fed rate hikes decreased after the meeting. The softening of the dollar prompted gold to rebound, allowing spot gold to break free from the support area between the 4000 threshold and the double lows of June 11 and July 8 at 4025 over several sessions, instead probing the 4100 threshold (March 23 volatile low) resistance again. From an overall perspective, the market continues the low-level box volatility mode of the past five weeks, during which the broken upper rail of the downtrend since mid-May has repeatedly helped the market shake off bottoms. Regarding indicators, MACD resumed its ascent towards the zero axis; RSI reached the neutral zone, continuing to repair the previous mid-term weakness.
On the 4-hour chart, gold price repeatedly grinding the bottom above 4000 may be the process of consolidating another swing "higher low" after the first wave of rallies on July 17. In terms of price points, if the 4100 that repeatedly forms downward turning points recently is breached, then upward movement will still face the dense low-level area of December last year at 4165. The contest around this month's high to the mirror position of late June at 4215 will determine whether a valid bottom is built on the daily chart. Conversely, if the 4000 threshold is regained and then lost, it is feared that the momentum of prices testing the year's valley bottom support cannot be stopped. Regarding indicators, MACD formed a golden cross below the zero axis, with the fast line about to recover the zero axis; RSI rose into the strong zone, with trend strength switching repeatedly along with price volatility.
Resistance Reference: 4100, 4165, 4215
Support Reference: 4025/00, 3940, 3885
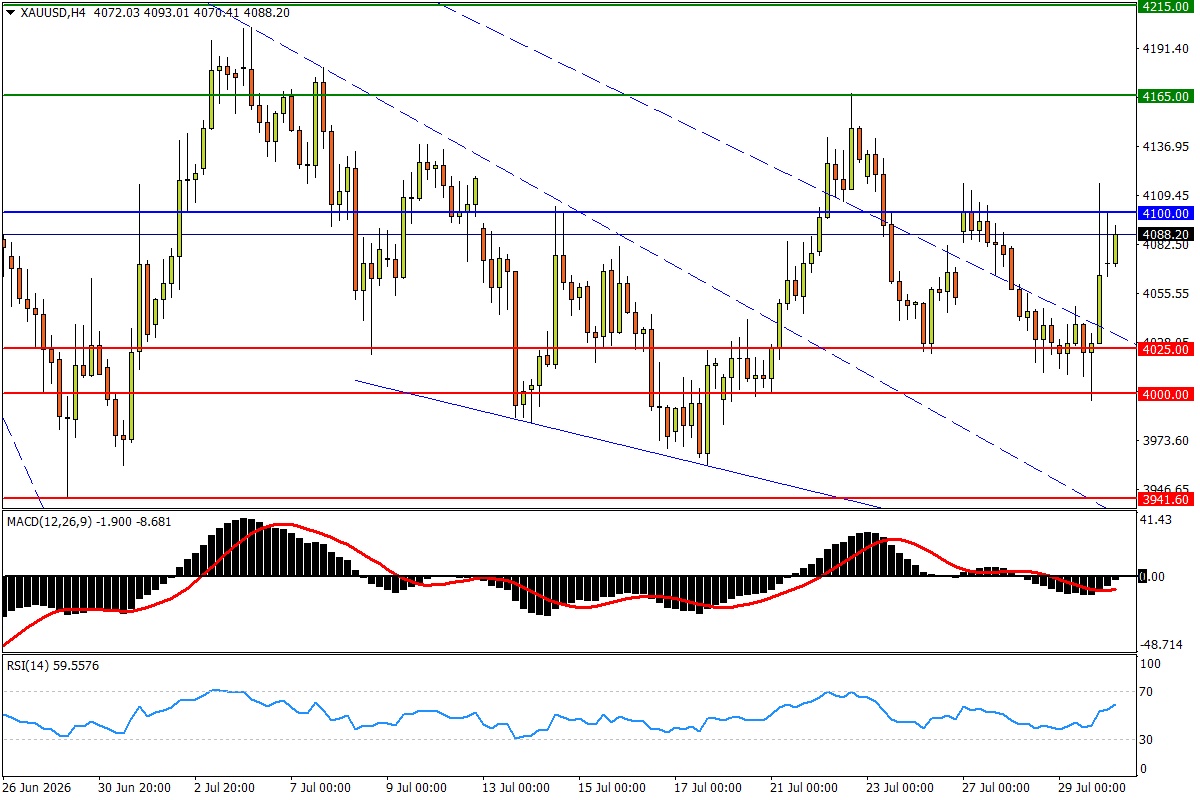
*XAUUSD H4 Source: FXTM
The copyright of this article belongs to the original author/organization.
The views expressed herein are solely those of the author and do not reflect the stance of the platform. The content is intended for investment reference purposes only and shall not be considered as investment advice. Please contact us if you have any questions or suggestions regarding the content services provided by the platform.
