


 Likes Received
 Posts
PostsIs Corning's 5.63 million short selling or collecting rent?
The company that crashed the entire optical communication chain in the last trading session became the underlying asset for the largest options order in the entire market the very next day. $5.63 million was placed on two Put contracts expiring on the same date. The question is whether this money is betting against Corning or wagering that it won't fall further—the directions indicated by the two data sources are exactly opposite.
Let's set the background first. Corning's Q2 accounts were impressive: sales of $4.74 billion, up 17% year-over-year; EPS of $0.78, up 30%; gross margin expanded by 120 basis points to 39.6%; adjusted free cash flow of $1.42 billion, compared to only $451 million in the same period last year. What fell wasn't profit quality, but revenue missing market expectations, combined with a soft Q3 guidance—just these two factors caused a single-day drop of 12.10% on July 28, with intraday lows touching $114.50, dragging down the entire chain including LITE, AXTI, and AAOI. JP Morgan and others lowered their target prices after the earnings report. Looking forward presents another picture: this company secured Apple, Meta, NVIDIA, and Amazon within half a year. The Springboard plan sets sales targets at $20 billion by the end of 2026, $30 billion by 2028, and $40 billion by 2030. On July 29, it closed at $124.05, accumulating a decline of 23.62% over seven trading days.
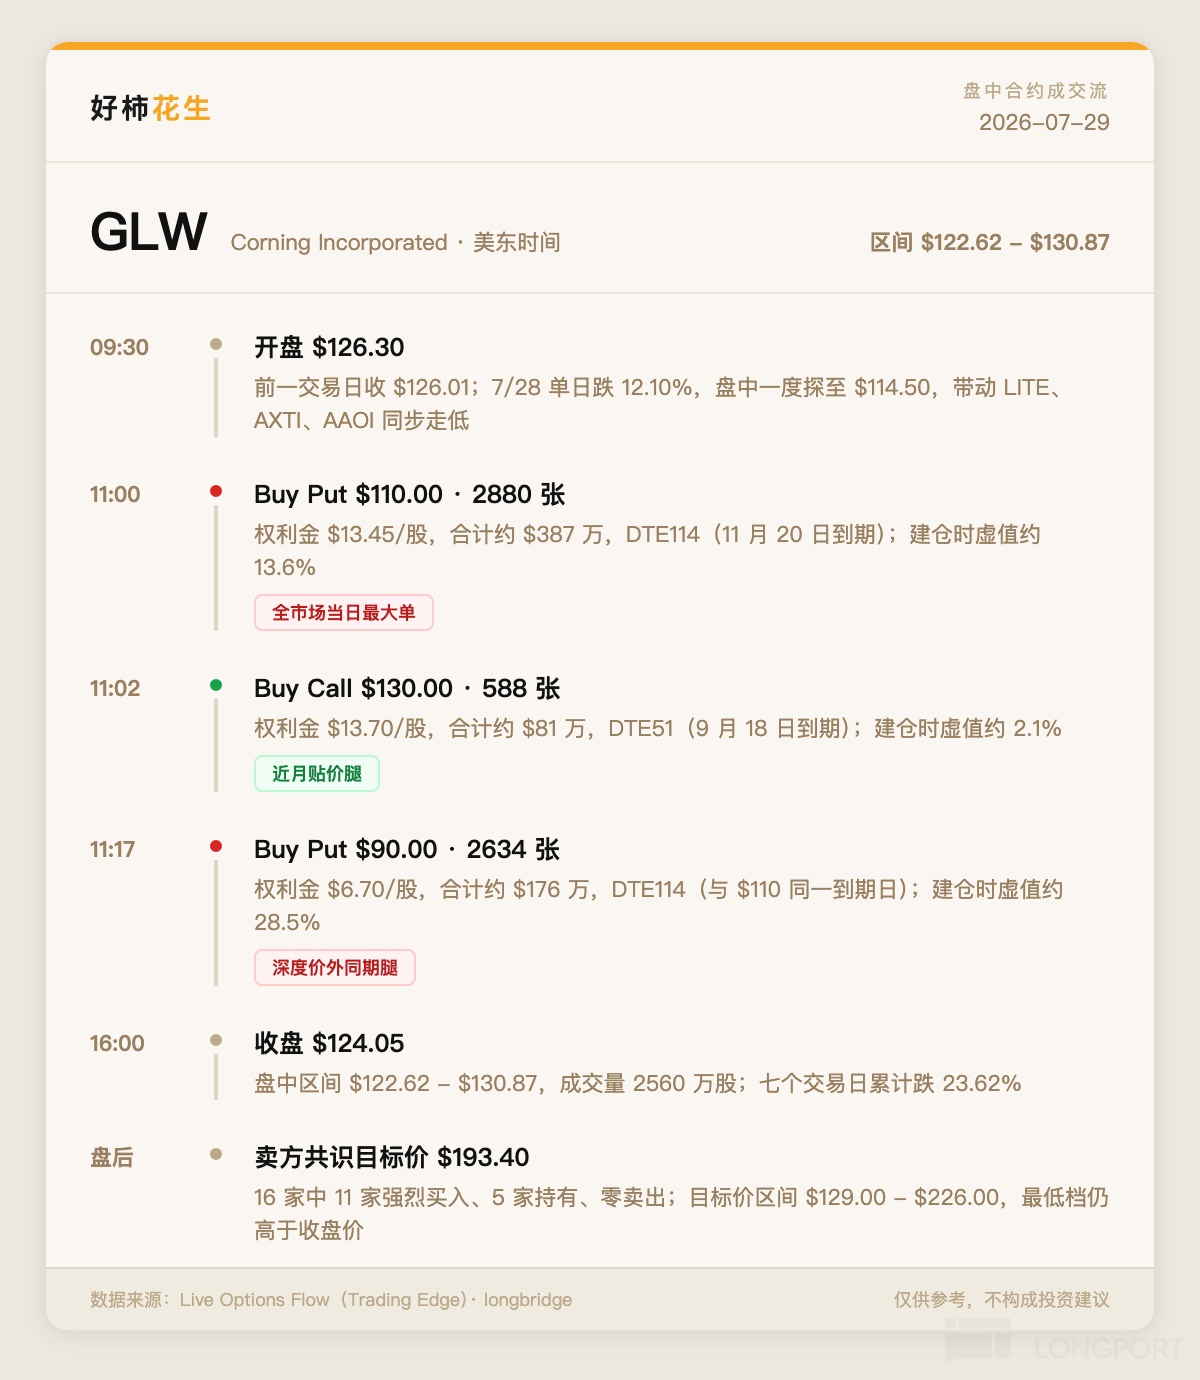
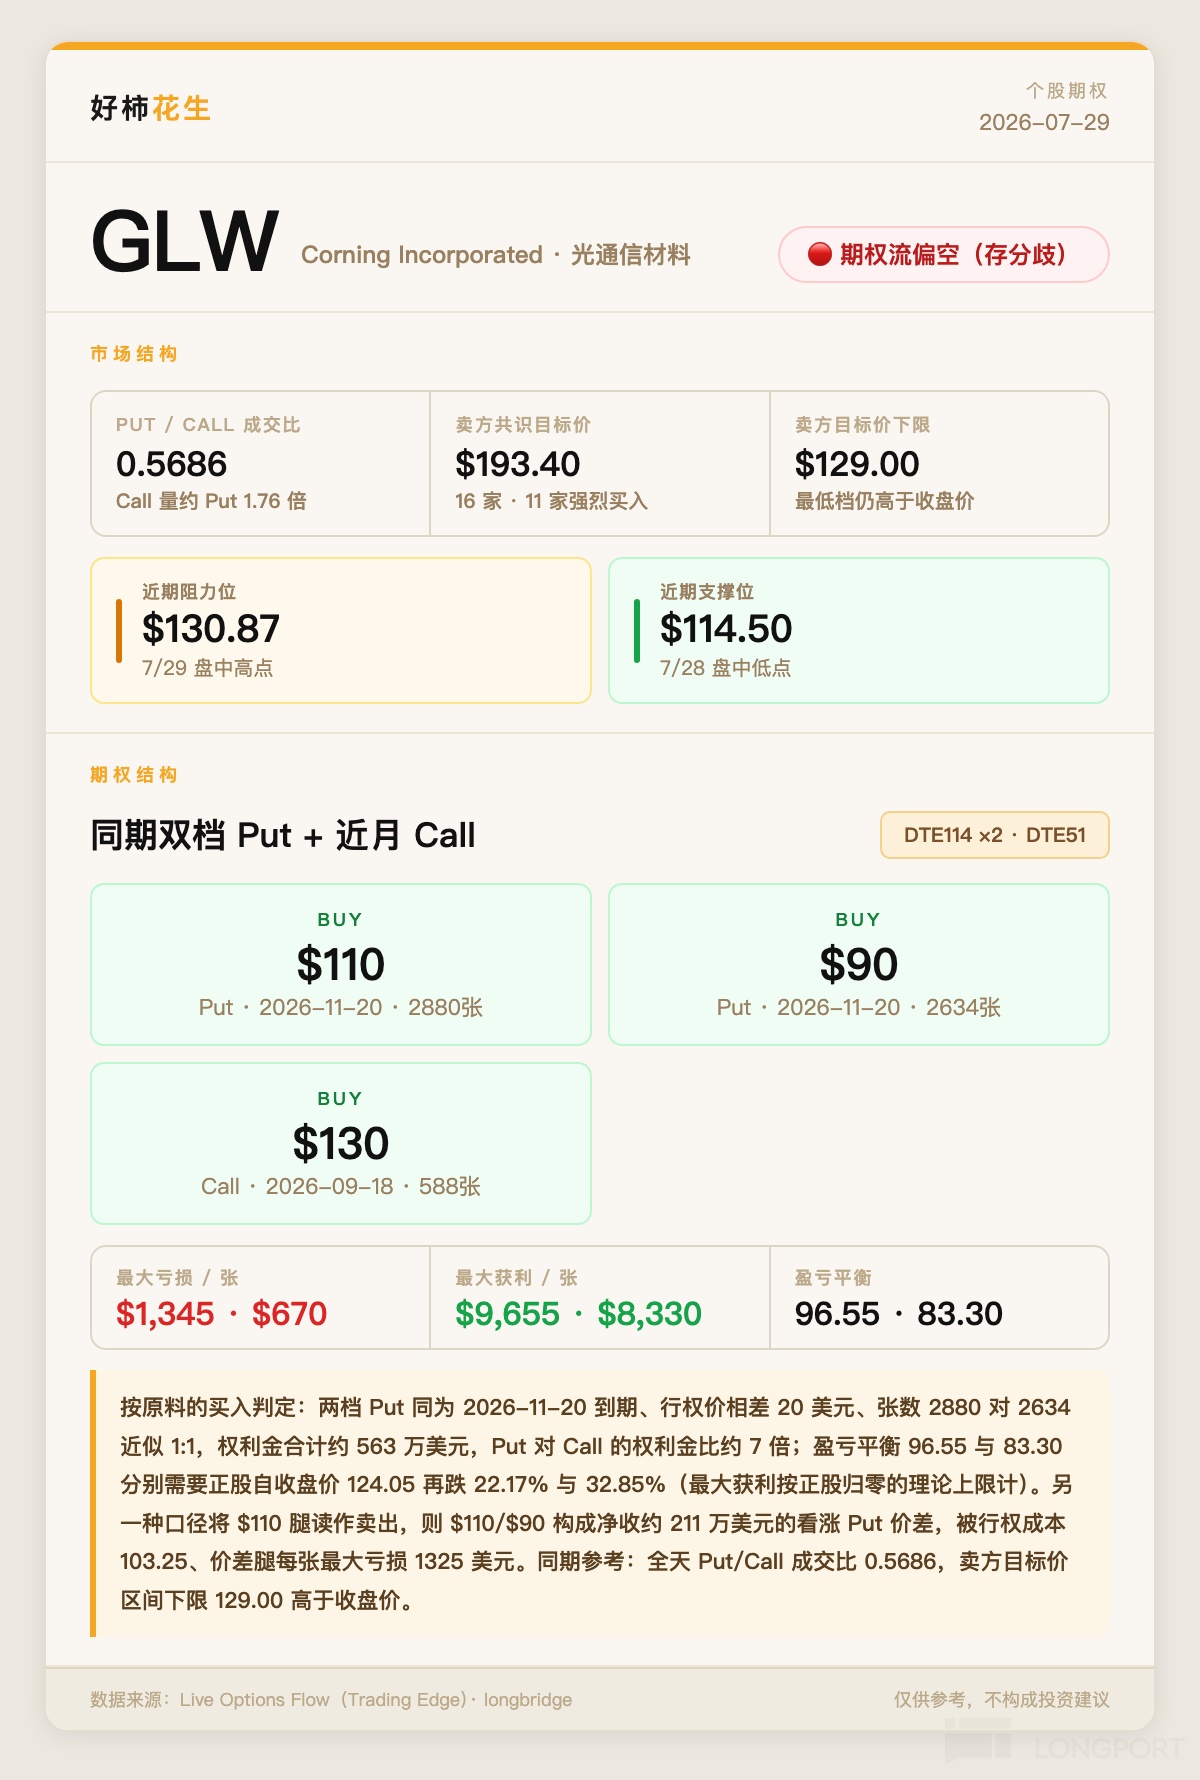
Three orders executed within seventeen minutes: $110 Puts, 2,880 contracts, premium $3.87 million, average price $13.45 per share; $130 Calls, 588 contracts, $810,000, average price $13.70; $90 Puts, 2,634 contracts, $1.76 million, average price $6.70. The premium ratio of Puts to Calls is close to 7:1, appearing completely one-sided. However, looking at the full-day volume, Corning's Put/Call ratio was only 0.5686—Call volume was 1.76 times that of Puts, indicating the overall tape was biased long. These three trades were isolated instances rather than consensus. Two Put contracts with the same expiration date, a strike price spread of $20, and contract counts of 2,880 versus 2,634 (approximately 1:1), this shape itself is a source of ambiguity.
Reading as a buy: The $110 strike costs $1,345 per contract, breakeven at $96.55, requiring the stock to fall another 22.17% from current levels. The $90 strike costs $670 per contract, breakeven at $83.30, requiring a 32.85% drop. The total outlay of $5.63 million equals a bet that Corning will break below $96.55 before November 20.
Reading as a sell: Selling the $110 collects $13.45, buying the $90 pays $6.70, netting $6.75 per share, forming a $110/$90 Bull Put Spread. Net premium collected is approximately $2.11 million, with an exercise cost of $103.25, resulting in a maximum loss of $1,325 per spread leg. As long as the price stays above $110 before November 20, both legs expire worthless. Adding the $130 Call, the overall structure remains a net credit of approximately $1.3 million, biased long.
I lean towards the latter interpretation. Three orders clustered within seventeen minutes: selling the $110 to collect rent, buying the $90 to cap tail risk, and buying the $130 to speculate on upside. This is a self-consistent bullish combination. Reading it as a buy requires explaining why the same capital would simultaneously bet on a drop below $96.55 while also buying $130 Calls. On the seller side, all 16 analysts covering Corning have target prices above the current level, with the lowest being $129.00, higher than $124.05, and the consensus at $193.40. Betting on $96.55 means going against the consensus of 16 firms. Furthermore, with Call volume being 1.76 times that of Puts, the directional balance is not on the short side.
The weakness of this interpretation is clear: its premise is that the three orders originated from the same trading desk, whereas public tape only shows execution prices and inferred direction, which cannot be proven. The labels of "buy" and "sell" are deduced from whether the trade hit the bid or ask price, which is precisely why the two data sources reached opposite conclusions. If the 2,880 $110 Puts were indeed bought, Corning would be the largest directional short in the market that day. The $96.55 breakeven implies the buyer believes the Q3 guidance issues will drag on until year-end.
There are two key price levels for the next observation. $114.50 was the intraday low on July 28; breaking below it starts favoring the bearish interpretation. Reclaiming the $130 area—the strike price of that Call, which also aligns with the July 29 intraday high of $130.87—would largely confirm the rent-collecting interpretation. More telling than these three trades themselves is the movement of open interest for these two Put contracts before November 20.
The copyright of this article belongs to the original author/organization.
The views expressed herein are solely those of the author and do not reflect the stance of the platform. The content is intended for investment reference purposes only and shall not be considered as investment advice. Please contact us if you have any questions or suggestions regarding the content services provided by the platform.
