
The overbought/oversold oscillator indicator was manually crafted using Gemini. Additionally, I've recently been learning to tinker with the EMA moving averages from YouTube blogger StockTalkwithJay to gauge market trends. These 4 EMAs may seem ordinary, but if the parameters are set correctly, they can indeed help to more clearly discern the trend:
Tradingview indicator name: 4 EMA Crossover w/alerts
MA1: Parameter 12 (light purple)
MA2: Parameter 21 (dark yellow)
MA2: Parameter 145 (pink)
MA4: Parameter 170 (light blue)
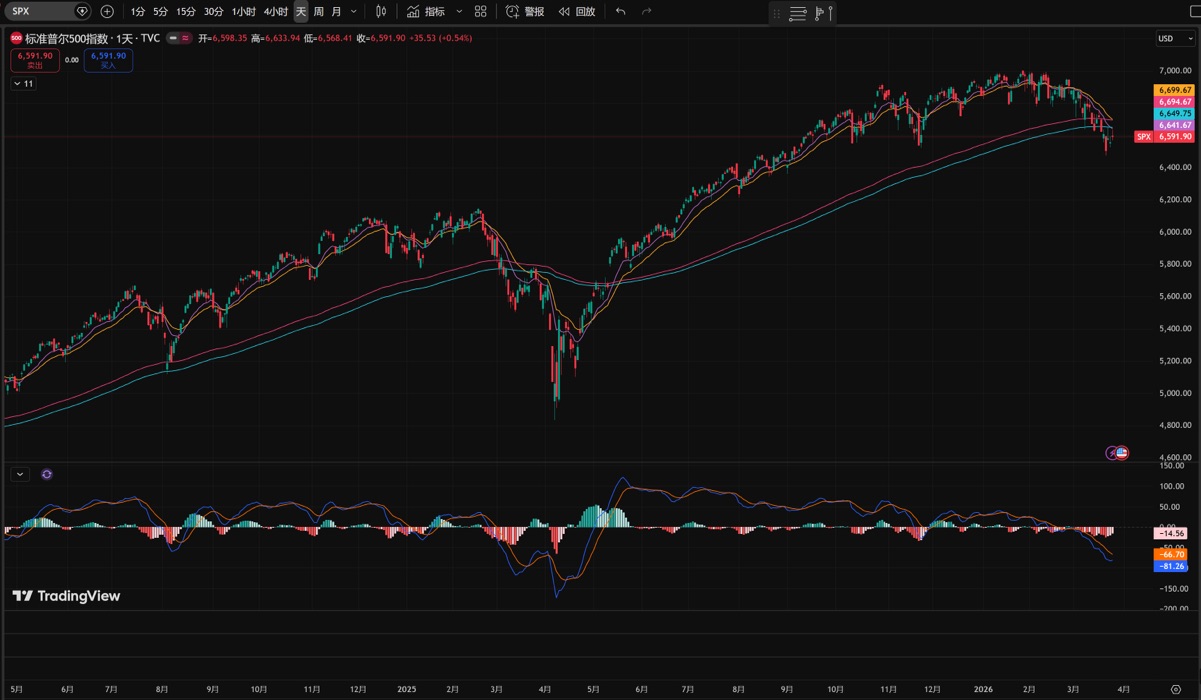
If you don't believe me, you can try setting it up. It's typically used to look at the SPX market index. In a bull market/primary uptrend, a golden cross often leads to an upward fan-shaped pattern; while in a bear market, after a downward death cross breaks below, it often forms an inverted triangle or a narrower downward fan.
Currently, it's just had a death cross. Although there might be a significant rebound later or in the near term, the major trend is downward with volatility, making the market very difficult to trade.
For the real market bottom, you can also zoom the indicator to the weekly chart. When it touches or breaks through the two lower, more distant EMA lines, combined with a Fear & Greed Index reading of 3~5, the VIX soaring to 40~60+, the Nasdaq index falling more than 20% from its high point, investors in despair, and the BTC crypto space in a "bloodbath," that's basically the bottom moment.
Even if a bear market bottom appears this year, you still need to have cash on hand to enter, rather than being trapped in other individual stocks. (So this year is a major bear market, but also a major opportunity.)

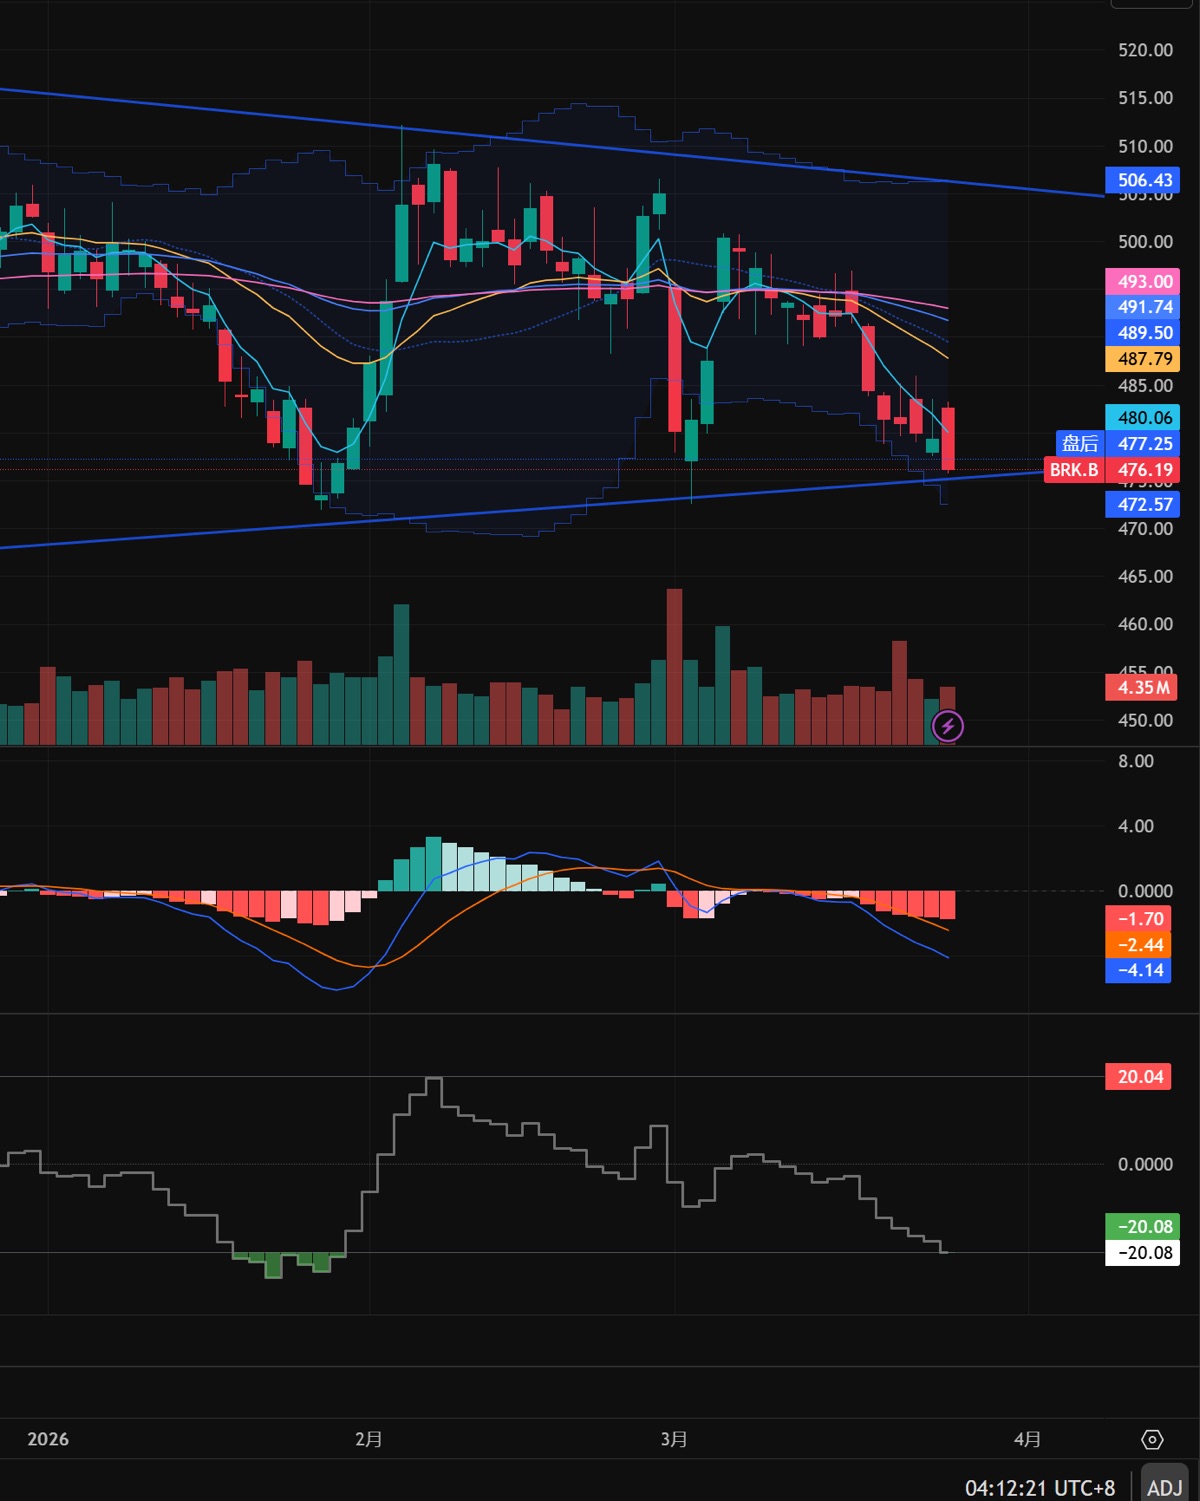
$Berkshire Hathaway B(BRK.B.US) won't enter the market unless the daily chart is oversold! When will I strictly respect my market indicator signals, when will I strictly follow discipline? Paid tuition again, the feeling of being pinned down and tortured🫥
In the final analysis, I think it's still greed in thinking and severely inadequate execution;
However, I really haven't understood this BRK.B recently. It's said to be a defensive stock, but why does it fall when the broader market falls; it also falls when tech stocks fall; it still falls when tech stocks rebound. In short, it's been oscillating downwards and falling all the time. I just don't get it;
Also, sometimes there are sharp rallies or drops in the pre-market/after-hours/night market, but it still shows a decline during the regular session. Sometimes it feels even more sneaky than tech stocks;
Regarding the understanding of price movements, sharp drops and rallies, and market waves, I think I'm still more familiar with SOXL and CRWV. At least they follow the market (soxl follows semiconductors, crwv follows NVIDIA). When there's good news, they rise as they should; when there's bad news, they drop sharply as they should; when there's a reversal, they reverse as they should. (A personal summary of some recent puzzling operations. Making mistakes isn't scary; what's scary is not knowing where you went wrong. Learn the lesson, improve, and hope to get my rhythm back.)
The copyright of this article belongs to the original author/organization.
The views expressed herein are solely those of the author and do not reflect the stance of the platform. The content is intended for investment reference purposes only and shall not be considered as investment advice. Please contact us if you have any questions or suggestions regarding the content services provided by the platform.
