
$SPDR S&P 500(SPY.US)
02/13/2026
Today's opening price was $681.690,
$SPY 260213 681 Call(SPY260213C681000.US) opened at $3.19,
$SPY 260213 682 Put(SPY260213P682000.US) opened at $2.98;
At market open, the Longbridge options calculator showed Put/Call IVs of 26.10%/25.00% respectively,
at 13:56, they were 14.50%/13.20%;
Volatility ranged from 0.70% at 09:42 to 1.29% at 13:56;
$SPY 260213 681 Call(SPY260213C681000.US)
opening IV was higher than usual,
correctly judged the opening volatile trend pre-market,
$Walmart(WMT.US)
09:41:45 $133.0800 => 09:43:50 $132.3050,
Thought to open a long position after the EMA Golden Cross,
but after buying, two consecutive bearish candles appeared,
should have entered when the bottom held for five minutes without breaking at 09:37,
and closed immediately if it broke down right after,
09:48:34 $132.8000 => 09:52:51 $132.6900,
Entering at a higher low was correct,
closed with a market order seeing it couldn't break through,
10:38:09 $133.4391 => 10:39:13 $133.2650,
Didn't break the EMA20 line, should have continued holding,
Should have opened a position at 10:06, but drew a continuation of the pre-market downtrend channel on the chart,
Two position openings, two losses, should have been more confident the third time,
The theory was correct, just encountered a low-probability event,
Thought it should adjust today, but it's still an uptrend,
just opened with a sell-off first, driving the price to a low,
11:17:45 $134.1790 => 11:36:25 $133.9300,
Opening long at the intraday high carries great risk,
An excellent trader should be like playing a shooter game,
anticipate the enemy's position in advance, get ready to shoot,
by the time the enemy appears, they've probably seen you too,
getting hit is inevitable,
$GraniteShares 2x Long NVDA Daily ETF(NVDL.US)
10:52:00 $87.7480 => 10:59:06 $82.7800, LONG,
The entry point was correct,
just the trend didn't develop as expected, profit-taking was correct,
13:03:52 $83.0600 => 13:07:16 $83.1900, SHORT,
Shorting at the end of a trend is a big no-no, stopped loss in time,
13.09:26 $83.2400 => 13:22:33 $83.4725, LONG,
The trend isn't very strong, not suitable to trade this ticker today,
Summary:
1️⃣ Open the 1-minute chart of the ticker you plan to trade that day on your computer;
2️⃣ Fridays before long weekends are very difficult to trade, similar to around Christmas, basically quant-driven;
3️⃣ Next week tentatively only trade $Walmart(WMT.US), usually has a $3 intraday amplitude;
4️⃣ For 0DTE options, focus on Paper Trading first, no live trading,
Currently $S&P 500(.SPX.US) can't break through around 7000 points,
5️⃣ When both the 1-minute and 5-minute charts are trending up/down simultaneously, it's a relatively safe entry point,
6️⃣ Market closed next Monday, conduct a more detailed review of $Walmart(WMT.US).
 Long Image
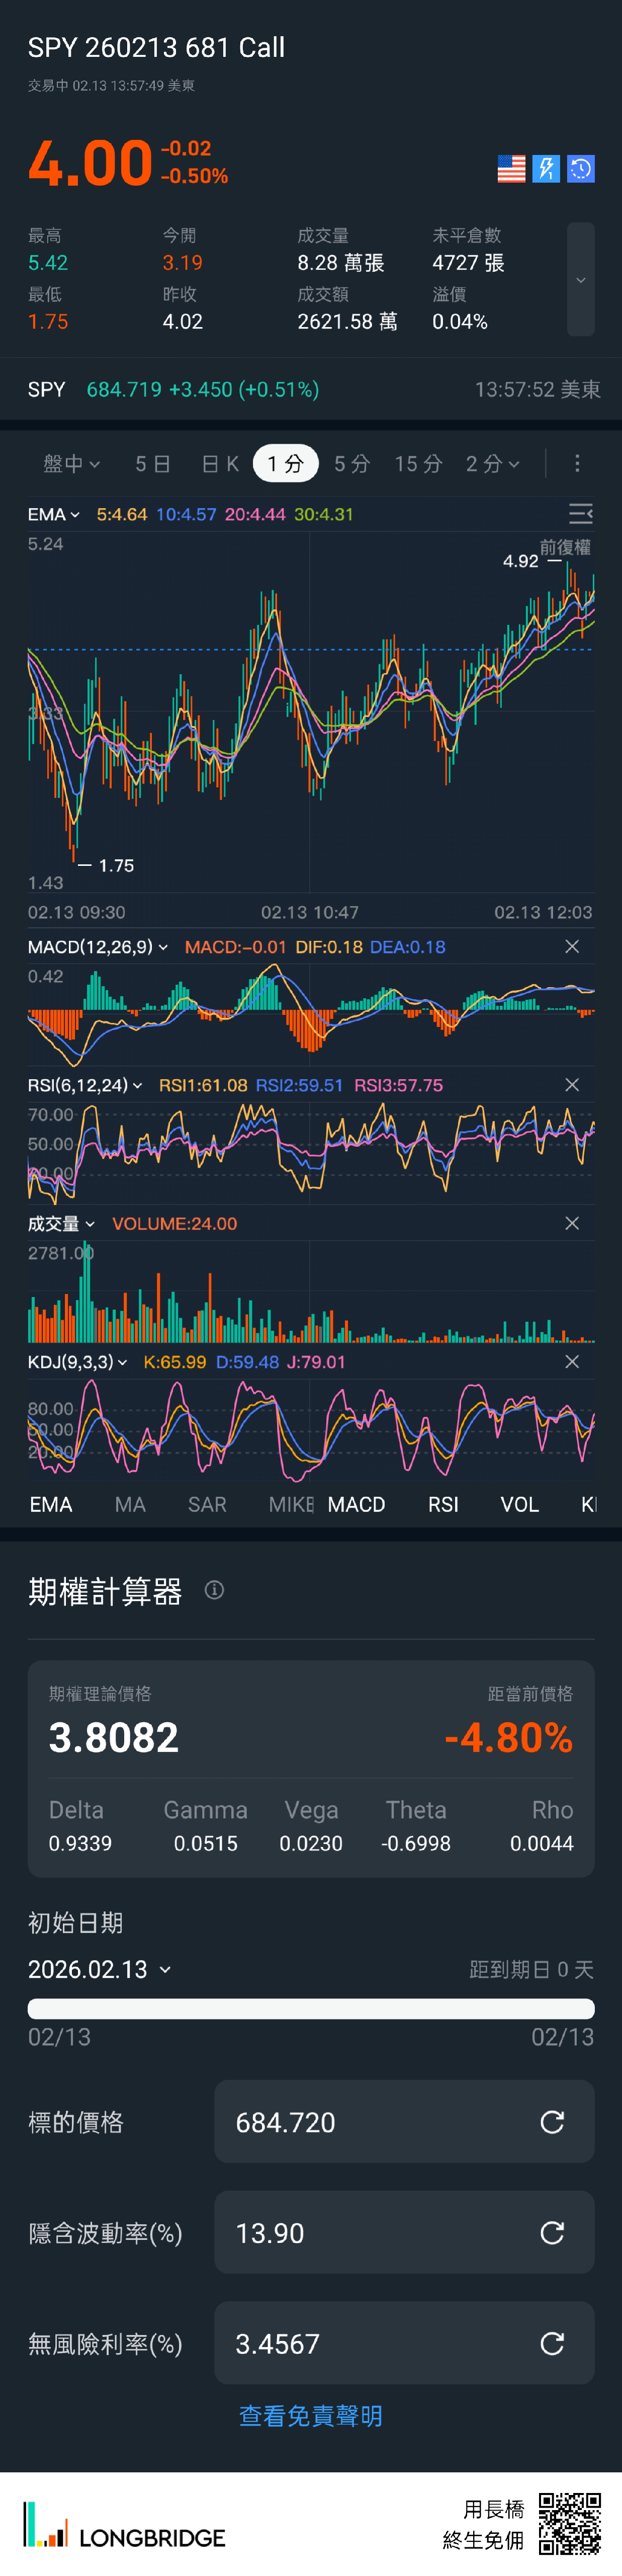 Long Image
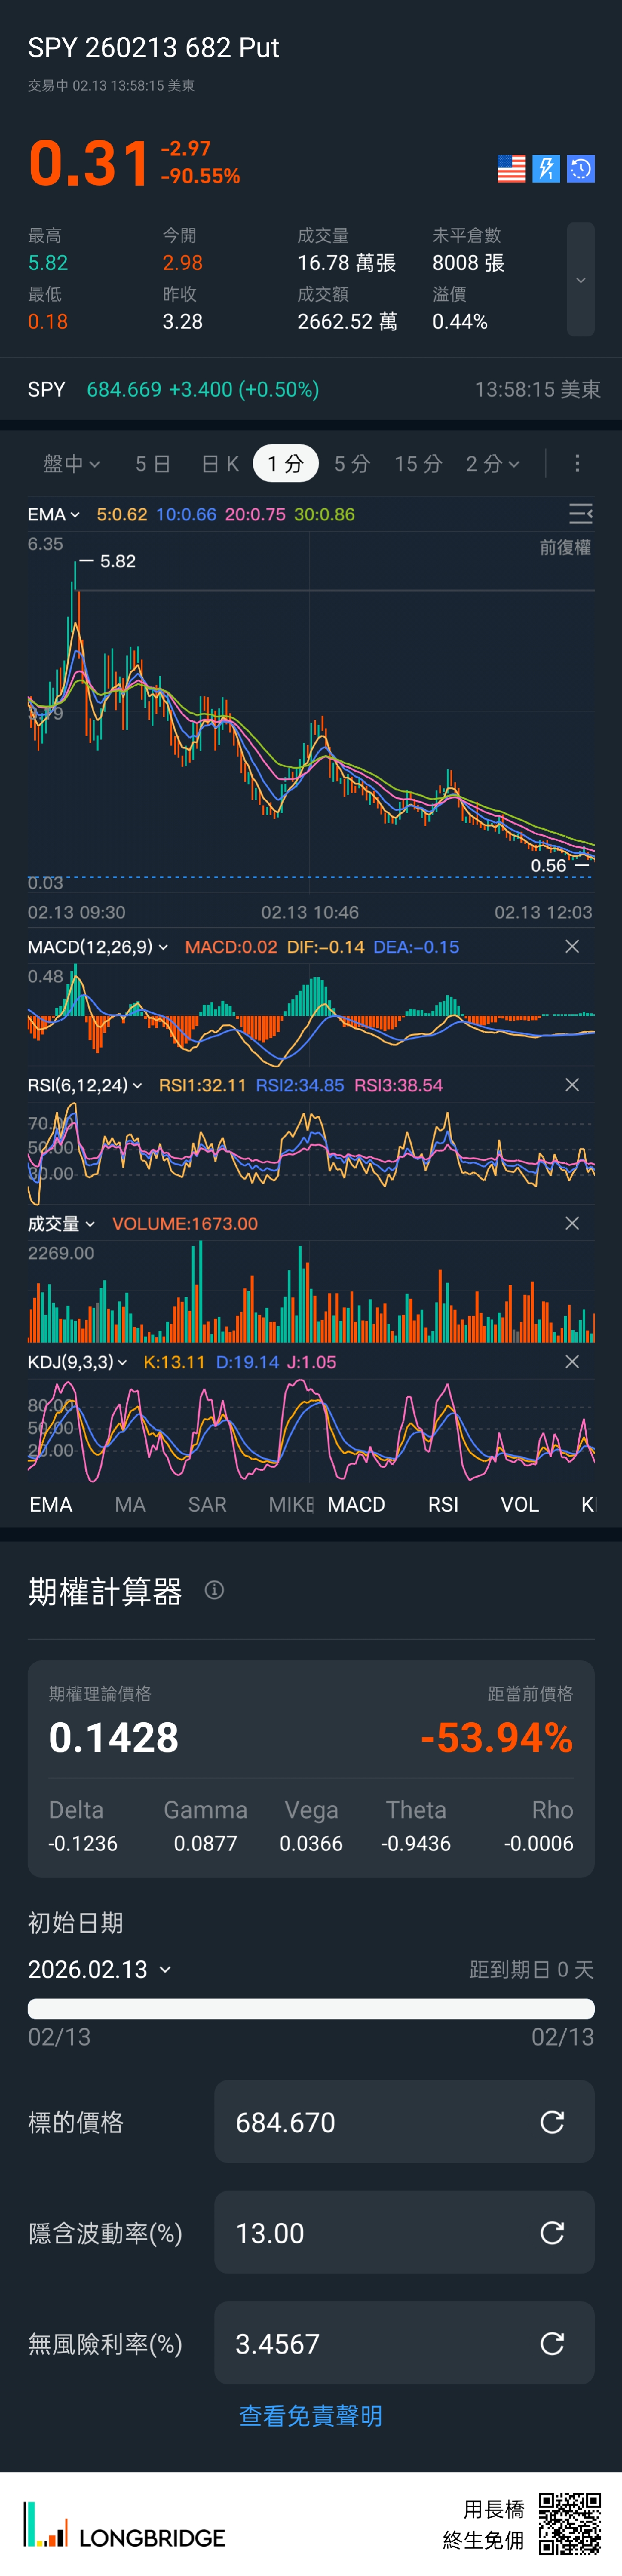 Long Image
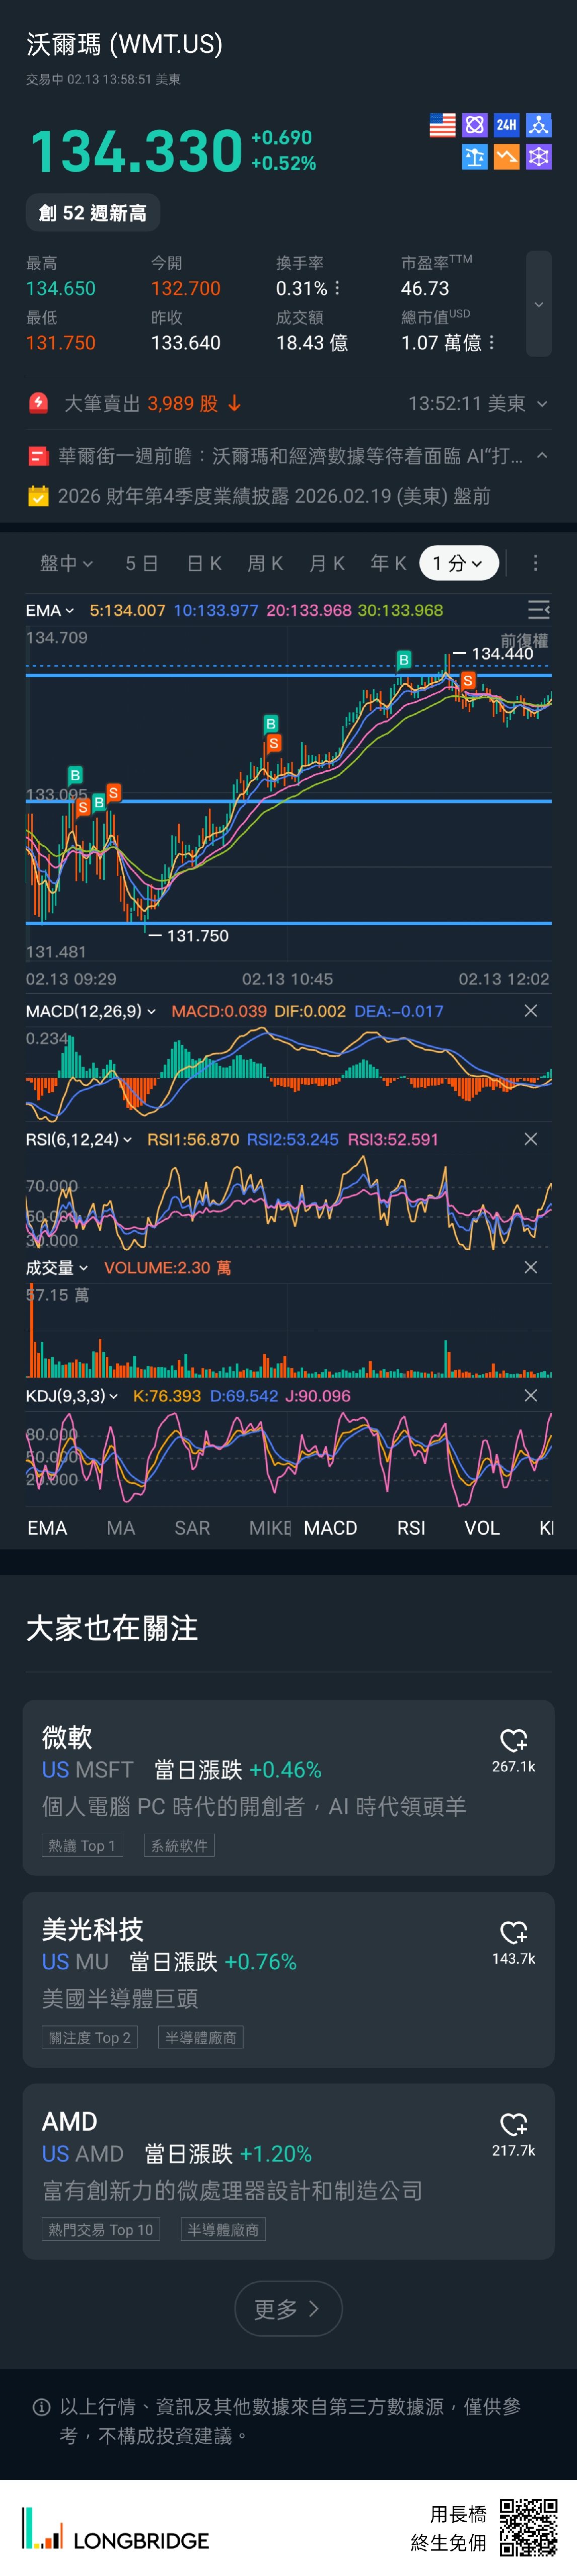 Long Image
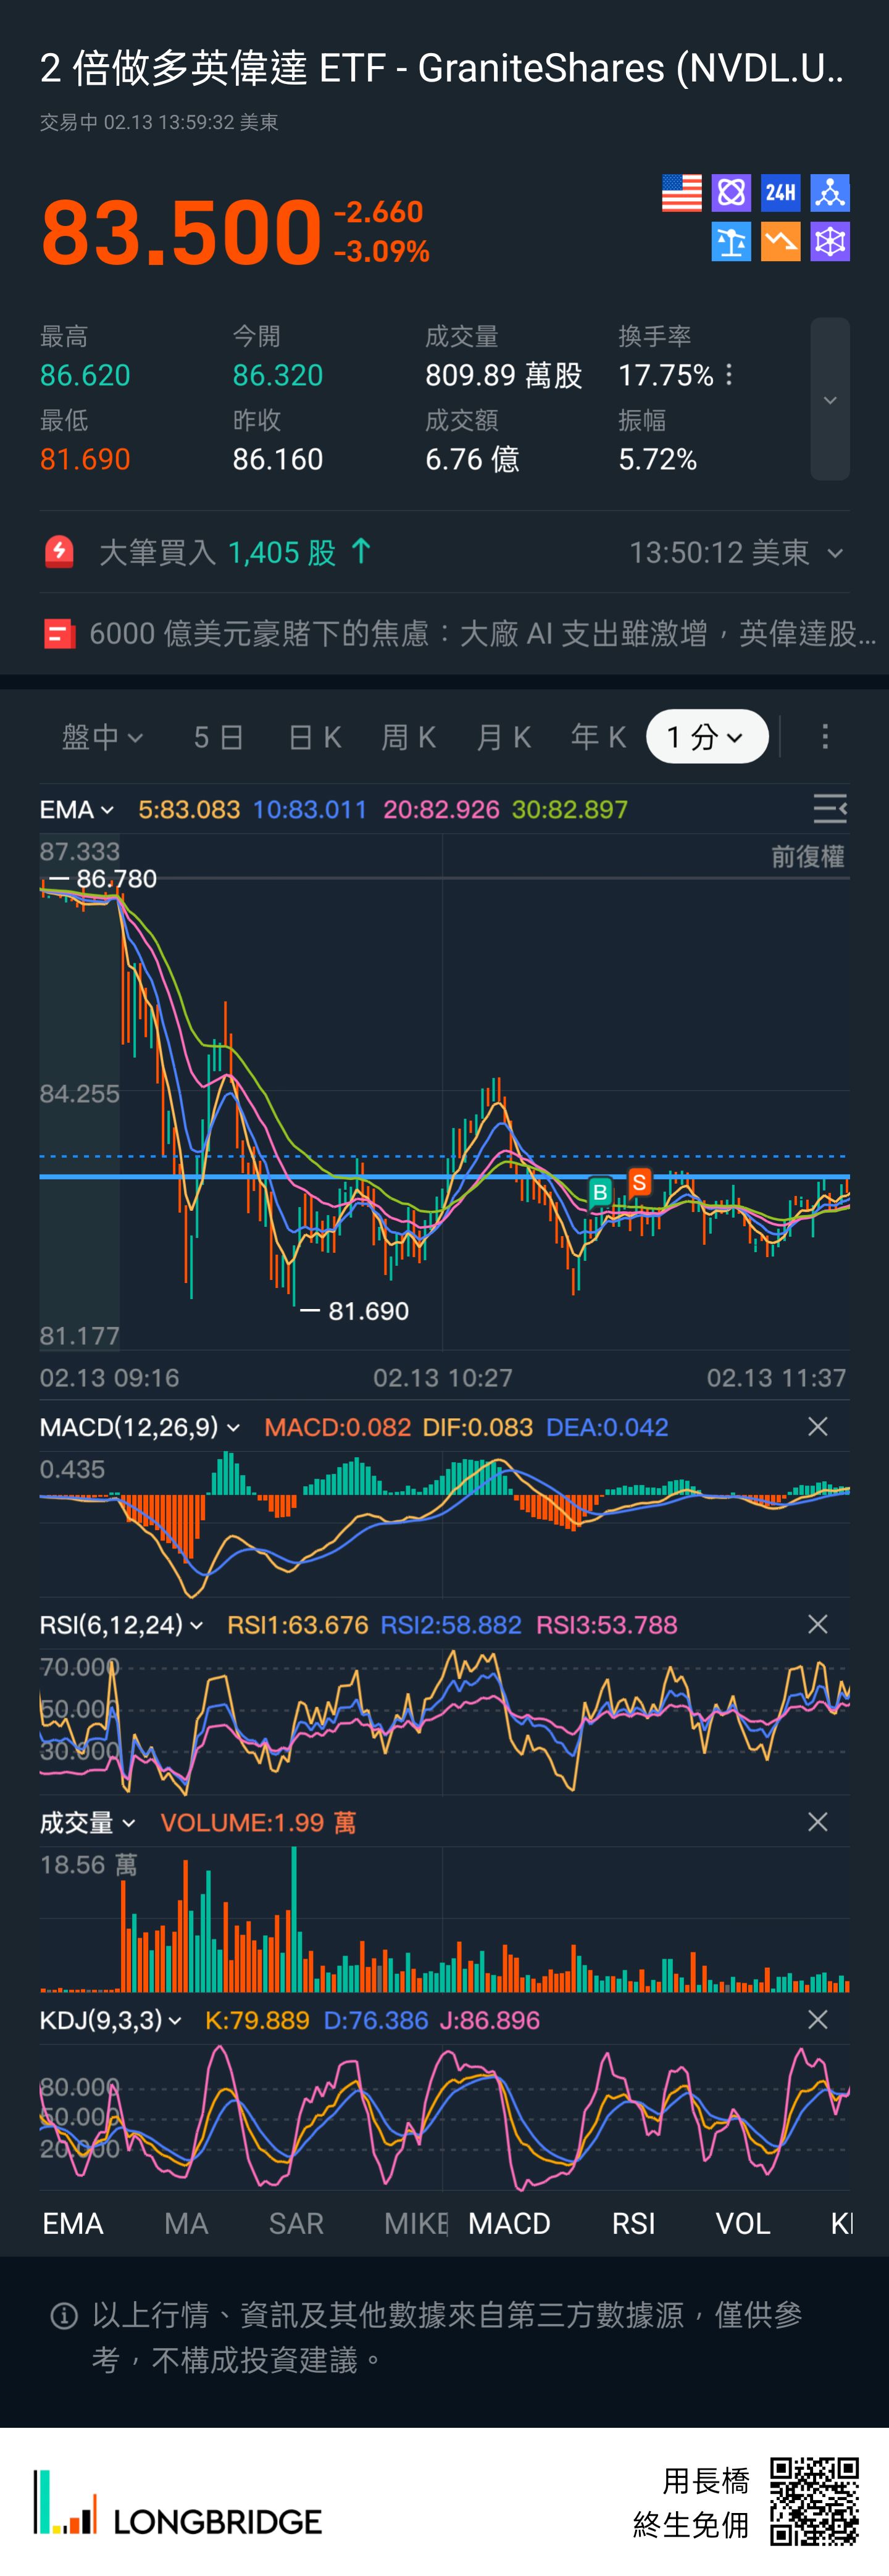 Long Image
 Long Image
The copyright of this article belongs to the original author/organization.
The views expressed herein are solely those of the author and do not reflect the stance of the platform. The content is intended for investment reference purposes only and shall not be considered as investment advice. Please contact us if you have any questions or suggestions regarding the content services provided by the platform.
