


MNST: Valuation in Overdrive — How Long Can the Honeymoon Last?
Monster Beverage released its Q2 2026 results in the early hours of Aug. 7 Beijing time (after-hours on Aug. 6 ET). Overall, the quarter was solid, with revenue and GPM both beating estimates. The hitch: marketing spend stepped up to court household consumers, driving a small OP miss vs. expectations.$Monster Beverage.US
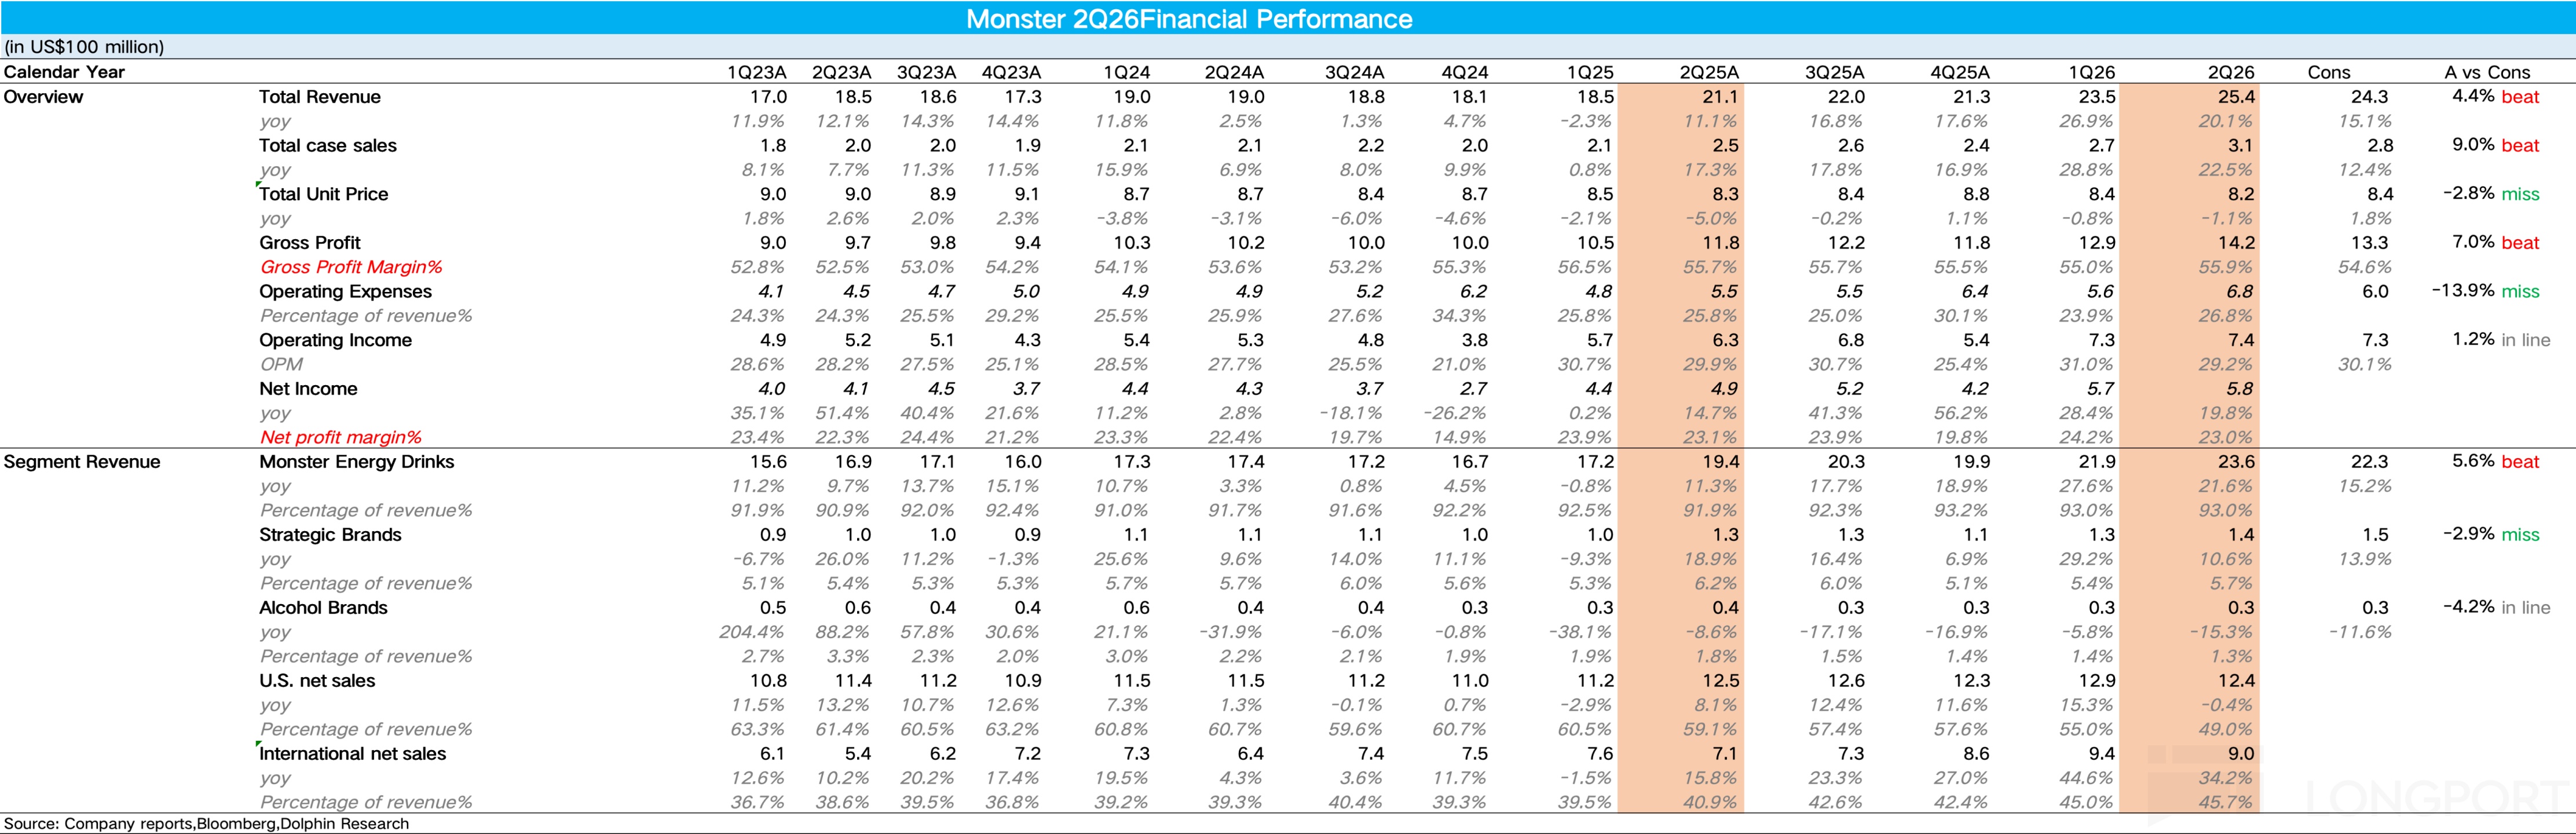
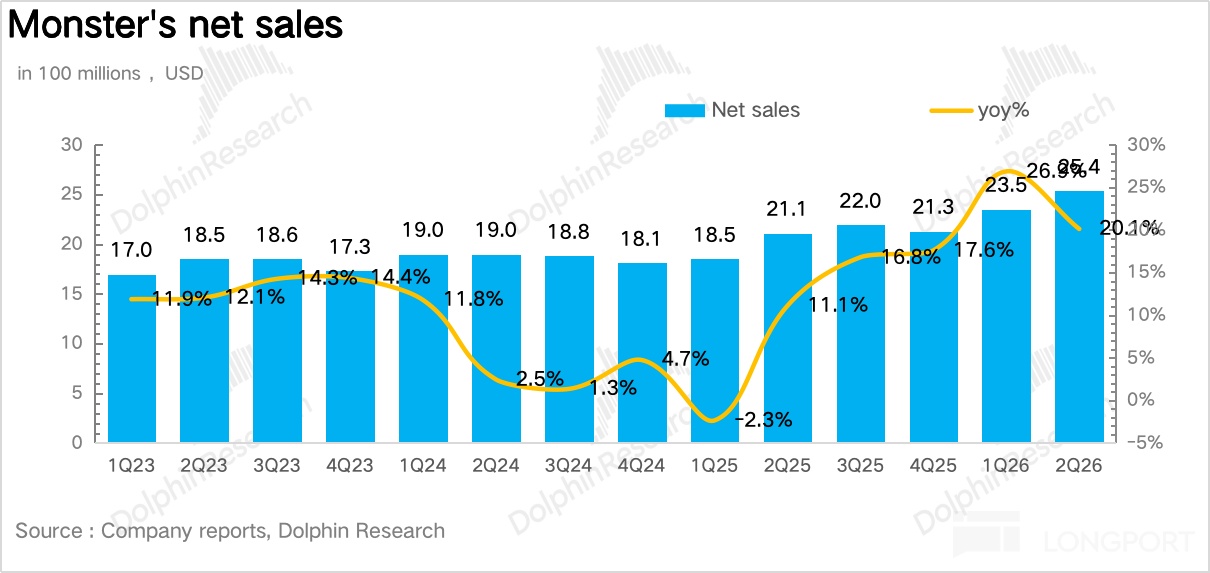
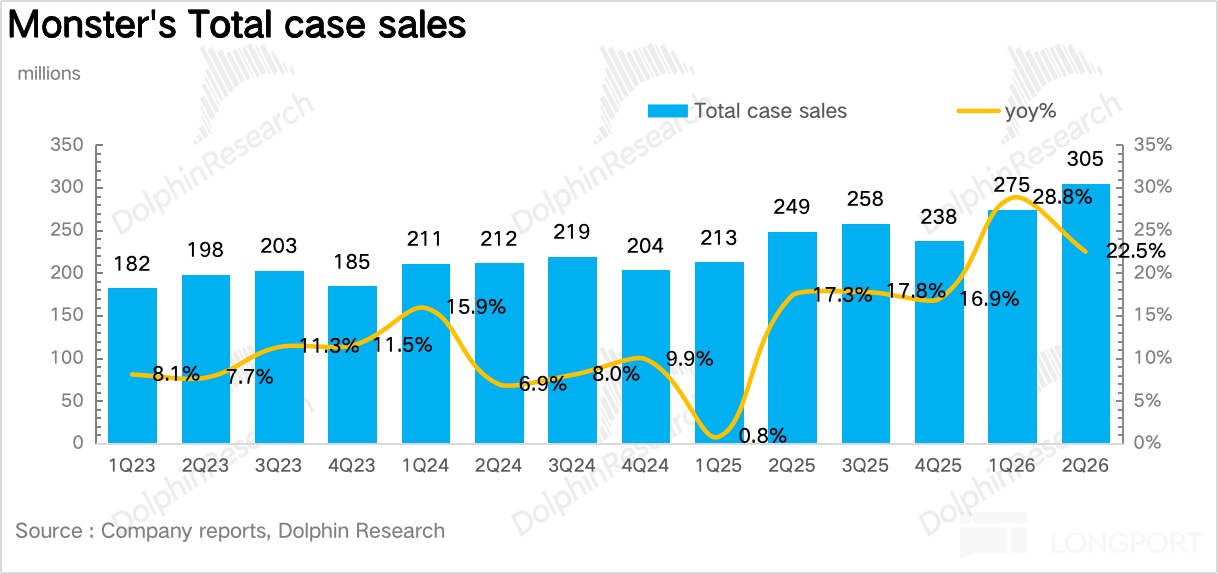
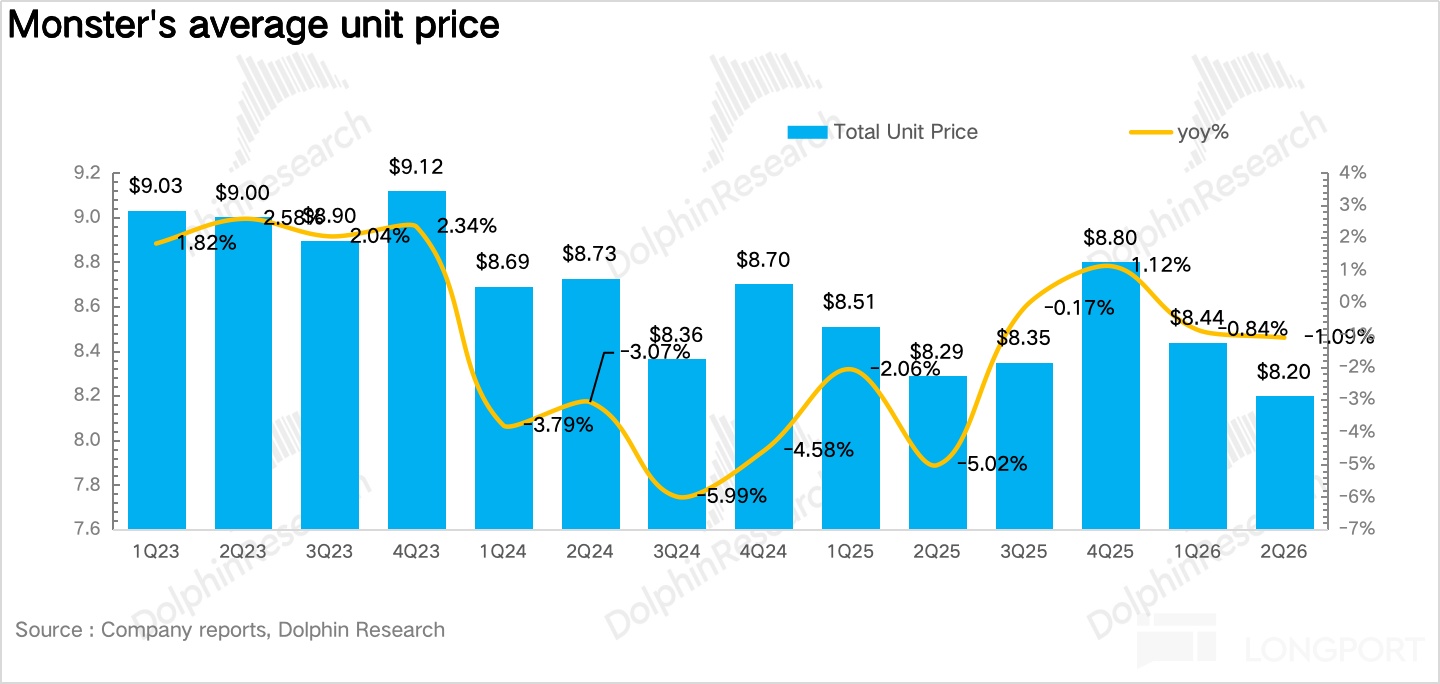
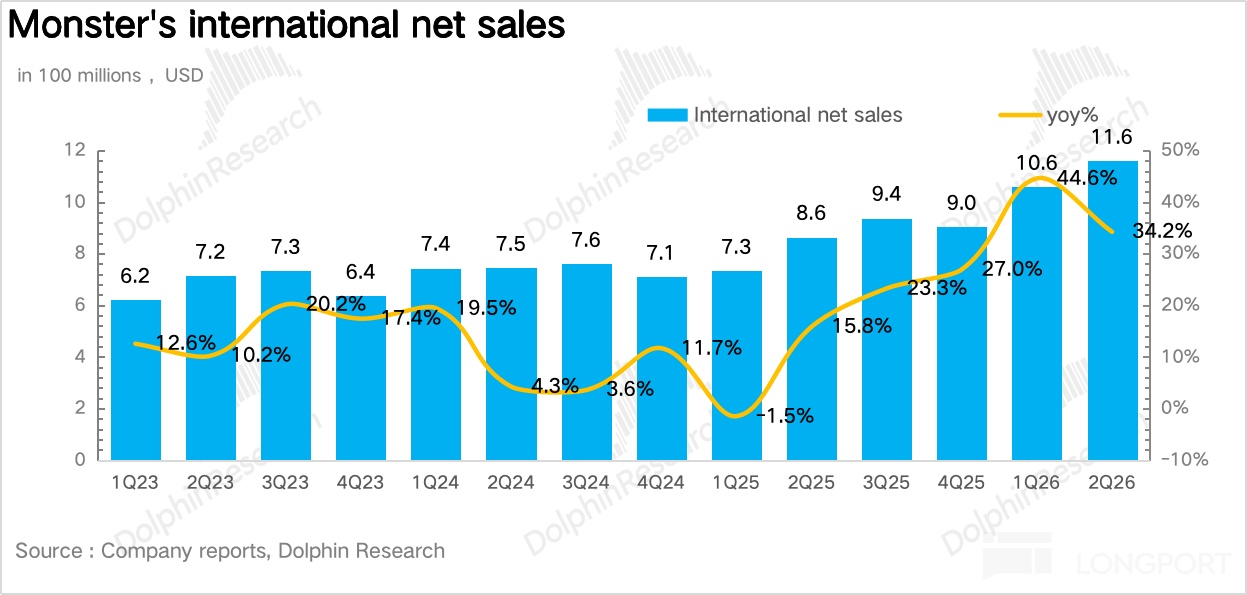
1) Revenue beat by a wide margin, volume remained the primary engine. MNST delivered sales of $2.54bn in Q2, up 20.2% YoY (consensus +15.1%). FX added $485mn; ex-FX, growth was 17.9%. By volume/price, unit cases rose 22.5% YoY to 305mn, still the core driver. ASP per case fell 1.1% YoY to $8.20, mainly as the lower-priced Intl mix expanded sharply (up 5ppt to 45.7%).
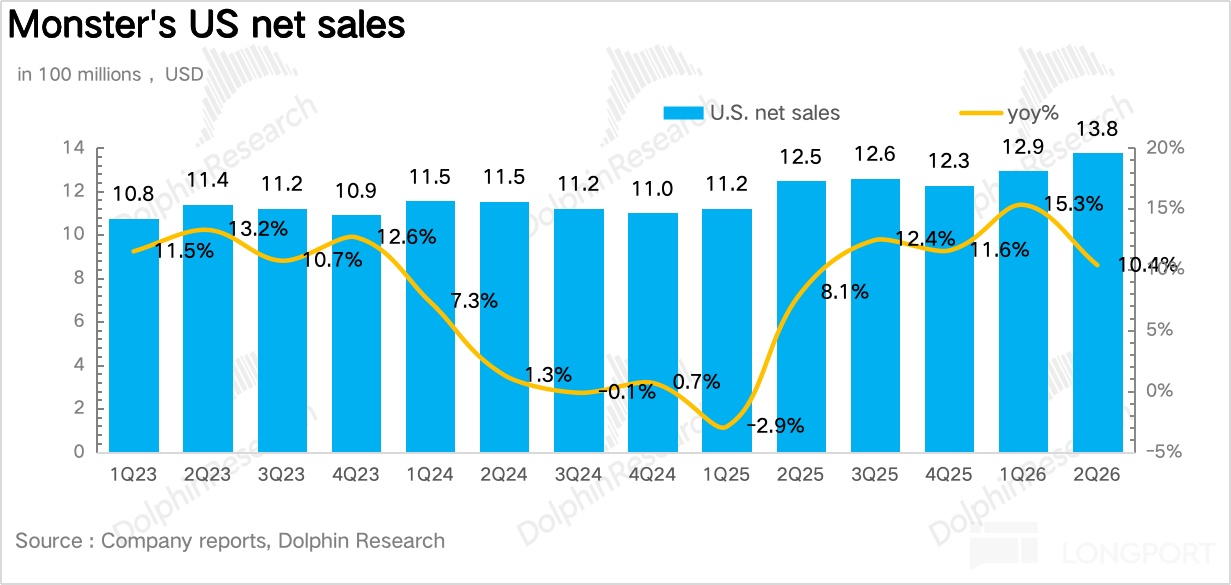
2) Intl stayed hot, while the U.S. did not stall. By region, North America revenue reached $1.38bn, +10.4% YoY, with a slight sequential decel off a high base. Intl grew 34% YoY, lifting the mix by 4.8ppt to 45.7%. Within Intl, EMEA was the standout, growing at more than 2x the category. MNST also gained share in Brazil, China, and India (Brazil +82%, India +84%, China +62.5%).
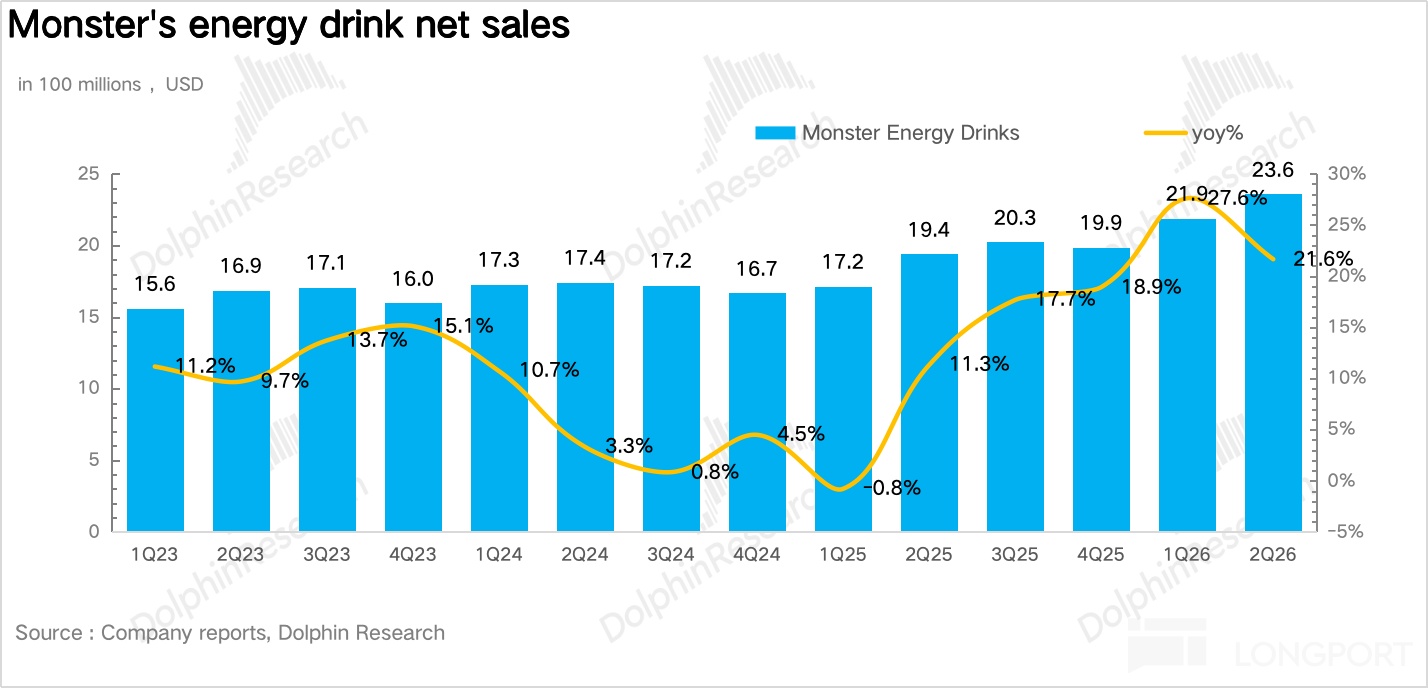
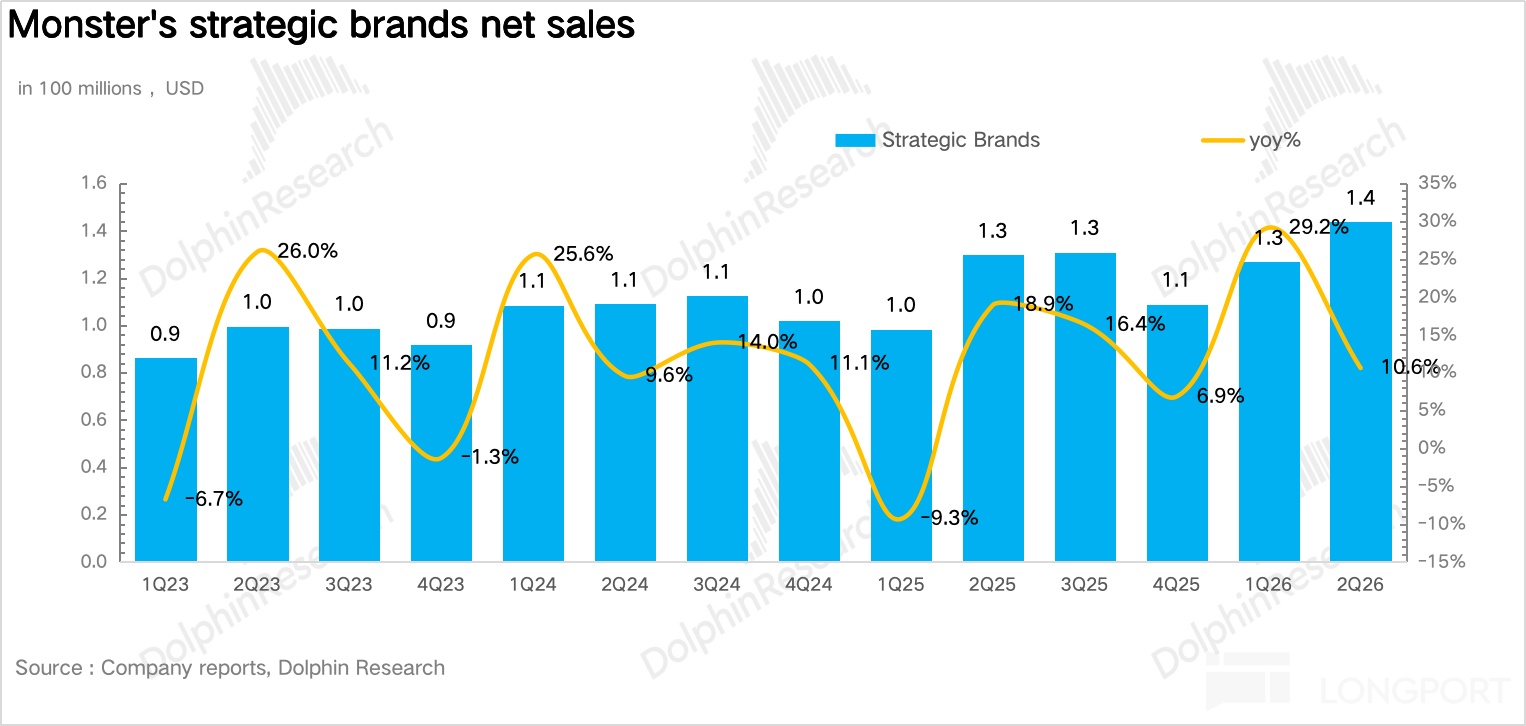
3) Core brand outpaced strategic brands, with new SKUs doing the heavy lifting. The Monster energy brand grew 21.6% YoY. The key incremental driver was innovation: per Nielsen, Ultra grew 19%. Seven new SKUs together accounted for 10% of Q2 sales in U.S. tracked channels and contributed 85% of H1 growth for the Monster family. Strategic brands were softer at +10.6% YoY, a clear slowdown.
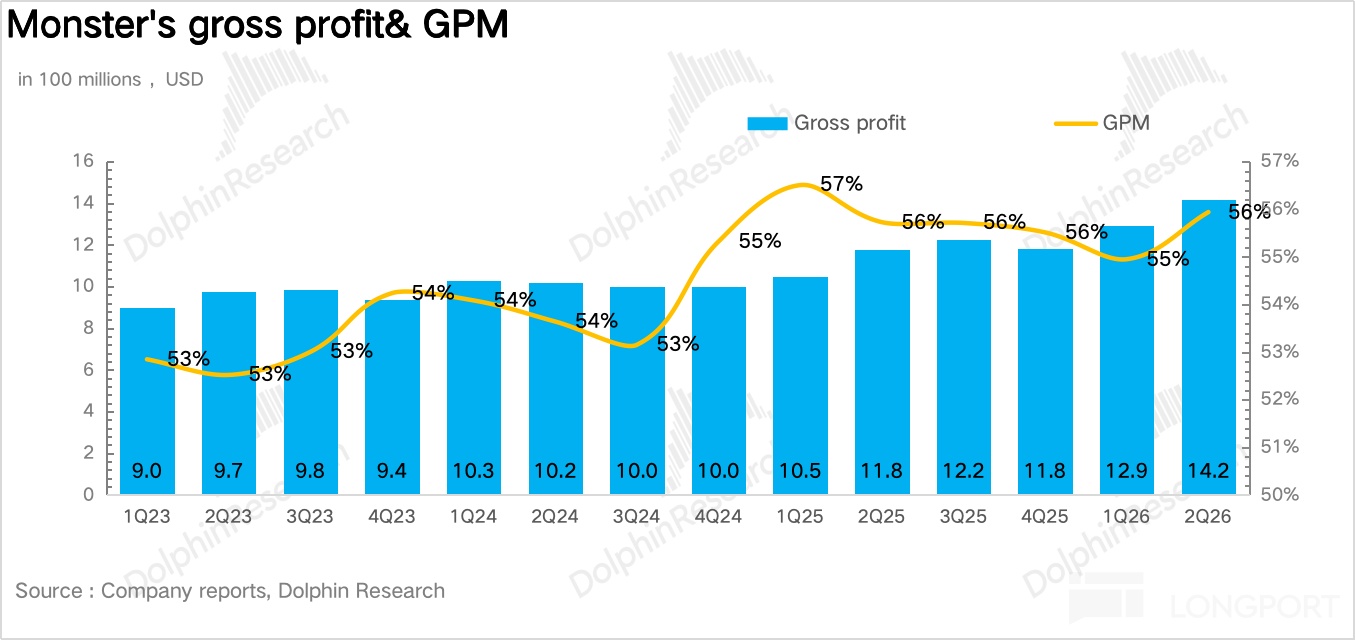
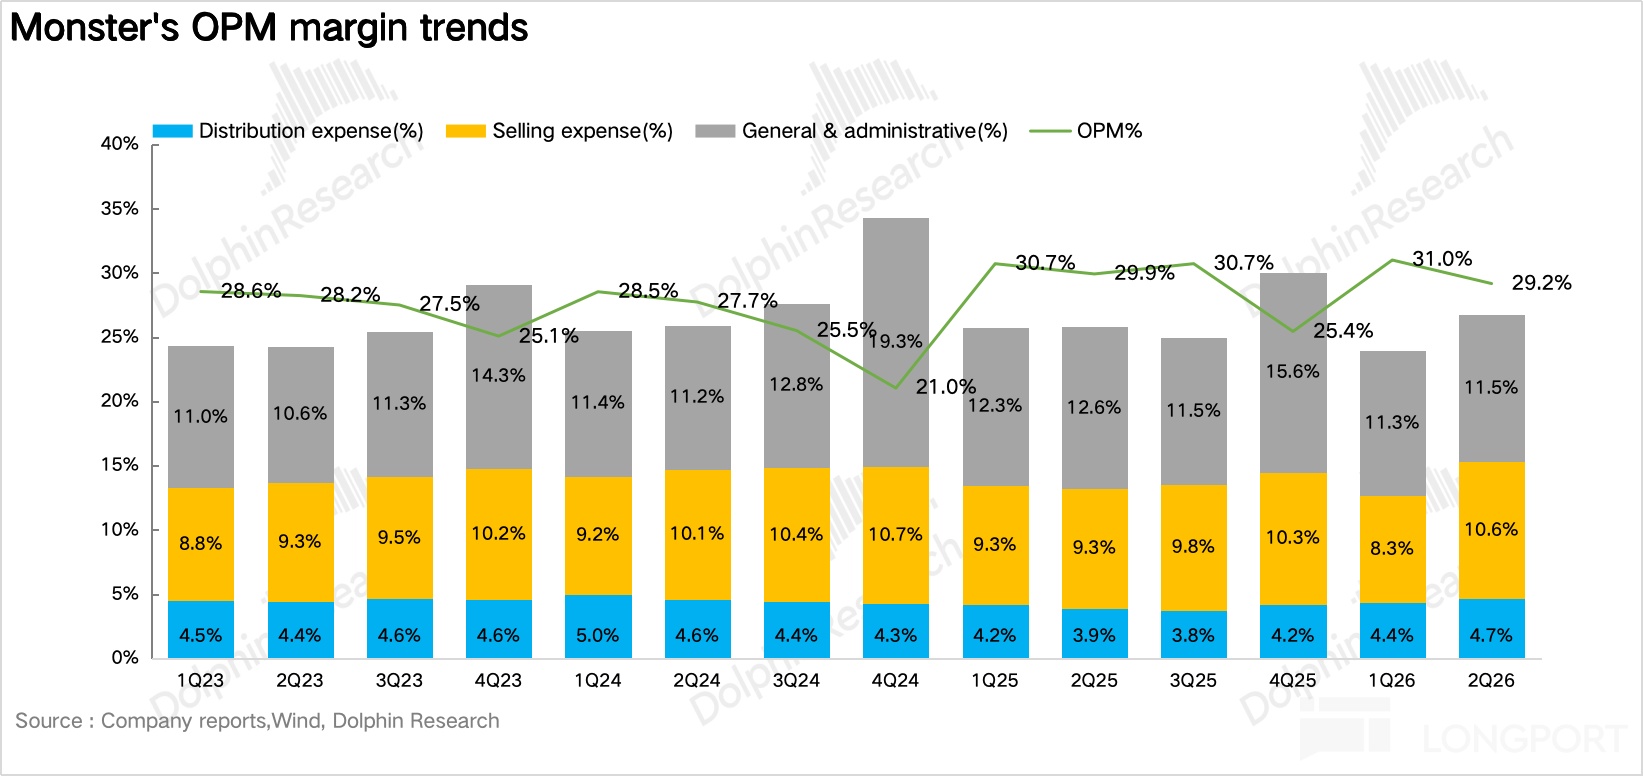
4) GPM surprised to the upside, but operating leverage lagged. Despite higher aluminum can costs and rising inbound freight, pricing actions and improved mix lifted GPM by 20bps YoY to 55.9%. On opex, heavier spend on social, digital, media, and sponsorships to boost household penetration drove S&M up 36.7% YoY. The total opex ratio rose 100bps to 26.8%, which was below the Street.
5) Financials at a glance
Dolphin Research view:
In our Q1 review three months ago, we argued that at peak multiples comparable to Java in 2012 and Ultra in 2018, MNST could re-rate toward 40x and a $92bn market cap, implying ~16% upside. That target was reached by mid-Jul.
Management commentary this quarter — 'new products contributed 85%' — corroborates the 2026 innovation-cycle thesis. But it also implies that legacy lines like Monster, Java, and Rehab are seeing little organic growth. With a high base next year, sustaining double-digit U.S. growth will require another wave of innovation of similar scale, which looks challenging.
On the positive side, even as ASP per case declined, GPM improved. We think this shows late-2025 price increases are flowing through, and brand mix is improving.
As a result, ASP per case is no longer a clean quality metric for MNST at this stage. It blends opposing forces from regional and product mix. Investors should focus on the relative growth of the Monster Energy vs. Strategic Brands segments, and on GPM itself — both improved this quarter.
As for heavier marketing this quarter, given 2026 is a big innovation year and new SKUs were outsized contributors, the ROI case is reasonable. Looking ahead, however, OPM improvement will need to come from GPM, while aluminum can costs remain a headwind. Management explicitly guided that, based on current aluminum prices and the Midwest premium, aluminum costs will likely drift up modestly each quarter through at least end-2026.
Valuation: at the latest after-hours price, MNST trades around 40x P/E. Over the past decade, its mean and median P/E are both near 33x. At this level, good prints are necessary but not sufficient; tactically, we prefer 'hold, don’t chase.'
I. Investment framework
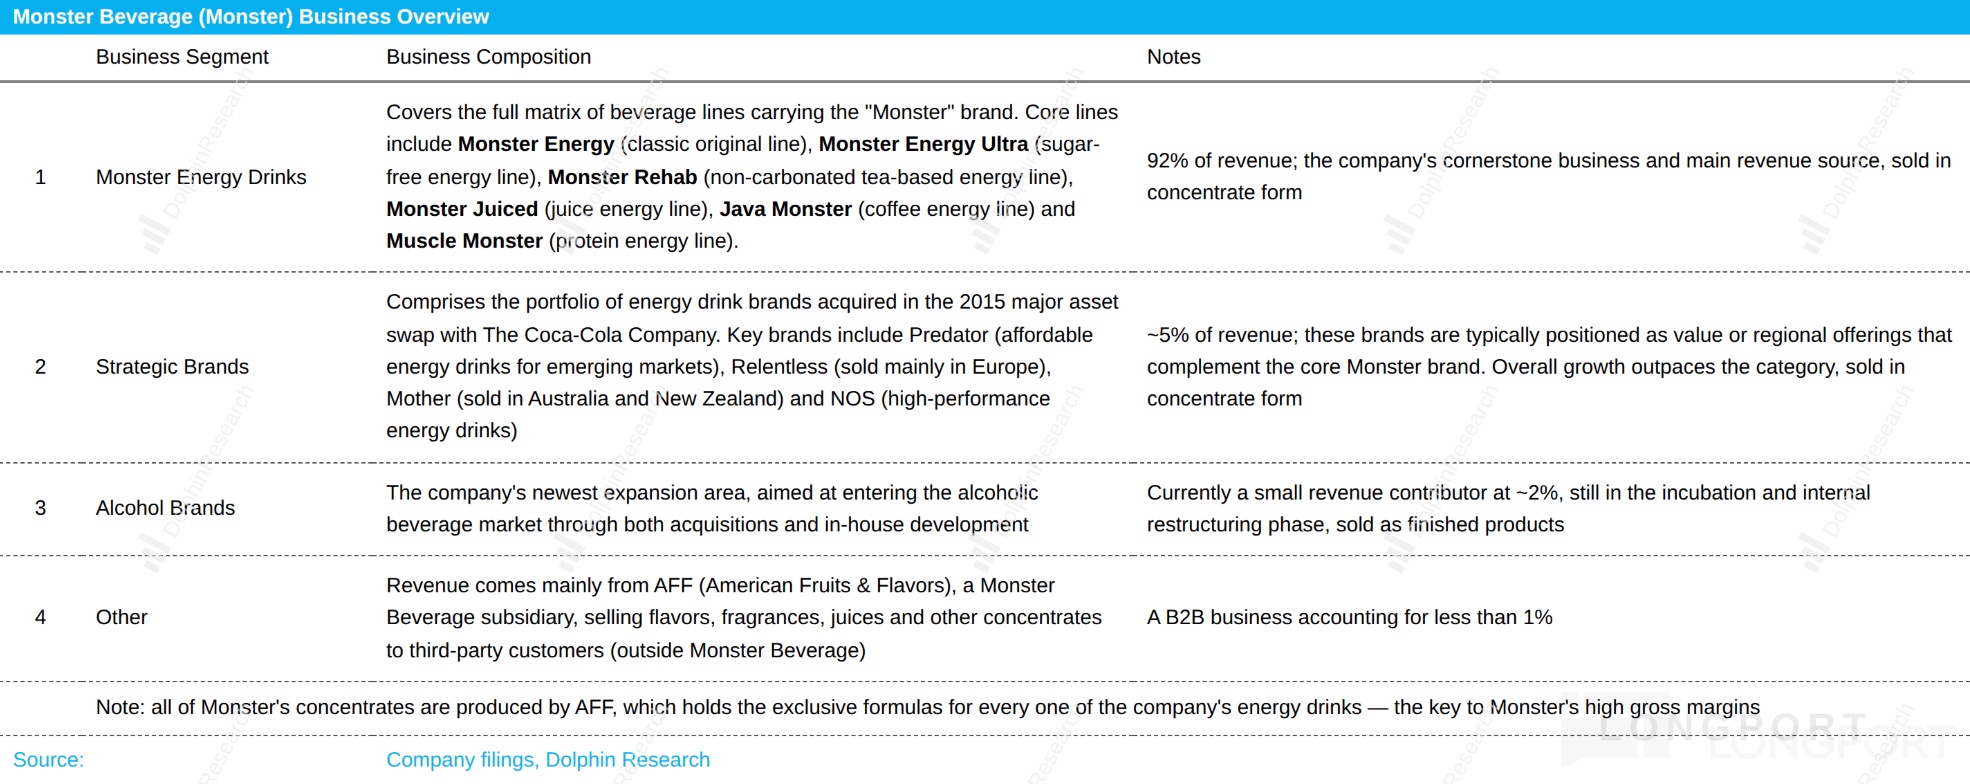
Per MNST disclosures, revenue growth breaks down into four pillars: the Monster Energy segment, Strategic Brands, Alcoholic Beverages, and Other.
(1) Monster Energy segment: the cornerstone and main revenue source, at roughly 92% of sales, covering all beverages under the 'Monster' brand. Core lines include Monster Energy (original), Monster Energy Ultra (zero sugar), Monster Rehab (non-carbonated tea-based), Monster Juiced (juice-based), Java Monster (coffee-based), and Muscle Monster (protein-based).
(2) Strategic Brands: mainly the energy brands acquired in the 2015 asset swap with Coca-Cola, positioned as value or regional complements to the core brand. Key labels include Predator (value tier for emerging markets), Relentless (primarily Europe), Mother (Australia/NZ), NOS (performance energy), etc. This segment is about 5% of revenue, growing slightly above the category.
(3) Alcoholic Beverages: MNST’s newest foray, pursuing alcohol via M&A and in-house development. The business is still small at roughly 2% of sales and remains in incubation and internal restructuring.
(4) Other: the smallest contributor, primarily AFF (American Fruits & Flavors) selling flavors, essences, and other concentrates to third-party customers (outside MNST) — a B2B business. Note that MNST’s concentrates are all produced by AFF, which holds the proprietary formulas for its energy drinks and is key to sustaining high GPM.
II. Key charts
<End>
Dolphin Research past articles:
Reviews:
May 8, 2026 'Monster: Product Cycle Fans the Flames, Intl Ignites — A Sweet Turnaround?'
Feb. 27, 2026 Monster Beverage: A New Product Cycle Ahead — Another Big Evolution Year?
Deep dives:
Sep. 11, 2025 'Monster: Under Siege on All Sides — From Beast to House Cat?'
Jul. 23, 2025 'Monster vs. Red Bull — How the '100x' Beast Was Forged in 20 Years'
