


PDD: Behind the Profit "Fake Drop," a 100 Billion Bet Is Taking Shape
PDD released its financial report for the first quarter of fiscal year 2026, with a net profit of RMB 12.5 billion, a year-on-year decrease of 15%. The market reacted strongly, with the stock price falling 11%. The main reason was significant fluctuations in non-operating gains and losses, leading to a sharp decline in profits. Management proposed investing RMB 100 billion over three years, planning to "rebuild another PDD."
On May 27, PDD released its Q1 2026 financial report. Wall Street's initial reaction was to hit the sell button—the stock price fell 11% that day, briefly touching a 52-week low during trading. Triggering this stampede was a set of figures: Non-GAAP earnings per ADS were $1.38, 38% lower than the market expectation of $2.23. However, if you are willing to spend five minutes dissecting this report, you will find that the 38% miss has almost nothing to do with PDD's core business. What is truly worth writing about is another matter: management buried a slow-burning fuse in the report—three years, RMB 100 billion, and "rebuilding another PDD."
What Was Behind That 38% "Miss"
Let's start with the most basic breakdown.
PDD's Q1 net profit was RMB 12.5 billion, a year-on-year decrease of 15%; Non-GAAP net profit was RMB 14.1 billion, a year-on-year decrease of 17%. The reason for the decline lies not in gross margin, nor in customer acquisition efficiency, nor in out-of-control R&D investment—but in one line item on the accounting statement: Net other income/(losses).
This item was a positive RMB 3.26 billion in Q1 2025 but turned into a negative RMB 2.03 billion in Q1 2026, representing a single-quarter swing of RMB 5.29 billion. Coupled with interest and investment income turning from a positive RMB 220 million to a negative RMB 630 million, the total non-operating gains and losses dropped from +RMB 3.24 billion in the same period last year to -RMB 2.81 billion this year, with a total swing exceeding RMB 6 billion.
This RMB 6 billion swing fully explains the entire decline in net profit.
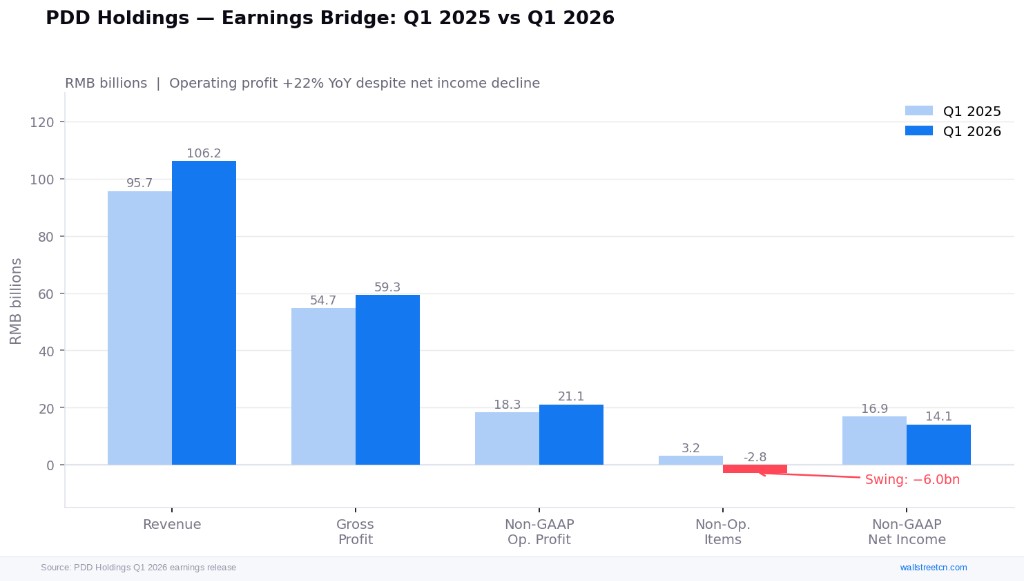
Figure 1: Operating profit +22% year-on-year; the decline in net profit is entirely explained by non-operating floating losses (RMB bn)
PDD did not disclose the detailed composition of this other income item. The general judgment of analysts at Goldman Sachs and others is that it reflects changes in the fair value of financial assets—PDD holds a large amount of available-for-sale bonds and equity investments, and interest rate and market fluctuations may have generated floating losses this quarter. Corroborating evidence can also be found in the cash flow statement: net cash flow from investing activities turned into a net inflow of RMB 2.08 billion this quarter (Q1 2025 was a net outflow of RMB 6.38 billion), indicating that some assets matured or were sold, and the reset process of the asset portfolio may have triggered the recognition of book losses.
It must be acknowledged frankly: due to the company's lack of detailed disclosure, the judgment that this is "one-off" carries uncertainty. If PDD continues to allocate large-scale investments to AFS securities, similar floating losses could occur every quarter. Part of the 11% drop given by the market vote is precisely a reasonable discount for this uncertainty.
But returning to the core operational level, the figures are quite clear: GAAP operating profit was RMB 19.6 billion, a year-on-year increase of 22%; Non-GAAP operating profit was RMB 21.1 billion, a year-on-year increase of 15%. This is a report showing operational improvement, obscured by the noise of non-operating floating losses.
Operational Level: Three Real Pieces of Good News
Stripping away the non-operating items, the remaining picture is much better than the headline figures suggest.
The first piece of good news is sales efficiency. Sales and marketing expenses this quarter were RMB 33.8 billion, a year-on-year increase of only 1.1%, while revenue increased by 11% year-on-year. The expense ratio compressed from 34.9% in the same period last year to 31.8%, a decrease of 310 basis points. Against the backdrop of intensifying stock competition in domestic e-commerce, this figure means that PDD's platform network effects are yielding scale benefits—the cost of customer acquisition and retention required for each additional yuan of revenue is continuing to decline.
The second piece of good news is the acceleration of transaction service revenue. Transaction service revenue this quarter was RMB 56.3 billion, a year-on-year increase of 19.9%, accounting for 53.0% of total revenue, up from 49.1% in the same period last year. This revenue line includes transaction commissions, logistics service fees, and platform service fees. With a growth rate approaching 20% and consistently higher than the growth rate of online marketing revenue, it indicates that PDD's monetization method is shifting from advertising-dependent to transaction-service-oriented.
The third piece of good news is cash and operating cash flow. Operating cash flow was RMB 16.4 billion, a year-on-year increase of 6%, with solid quality. Cash plus short-term investments at the end of the period totaled RMB 436.1 billion (approximately $63.2 billion), with another RMB 95.2 billion in non-current other assets (mainly time deposits and bonds). Calculated based on 59.2 billion diluted shares, the net cash per ADS is approximately $42.7—accounting for about 44% of the current stock price. This "cash cushion" structure theoretically limits the downside space for the stock price.
An Overlooked Structural Issue: Why OMS Is Almost Stagnant
After discussing the good news, let's address something less favorable.
Online Marketing Services (OMS) revenue was RMB 49.9 billion, a year-on-year increase of 2.5%—in other words, this revenue line is close to zero growth. Meanwhile, transaction service revenue grew by 20%. The market tends to interpret this structural divergence as a "monetization upgrade," believing that PDD is actively switching to a higher-quality monetization model. This interpretation has its logic, but there is another reading worth noting.
OMS revenue essentially reflects how much advertising budget merchants are willing to spend on PDD. A growth rate of 2.5% means that the growth in merchant advertising spending is nearing stagnation. At the same time, Alibaba's Tmall advertising business has shown some recovery, while Douyin E-commerce, centered on content recommendations, has shifted traffic allocation power away from merchants—this model's appeal to brand advertisers comes from content distribution efficiency rather than bidding mechanisms, indirectly suppressing PDD's advertising pricing power.
PDD's bargaining power in the advertising market has systematically narrowed, judging by historical figures. From Q1 to Q2 2024, OMS growth was still in double digits. Entering 2025, OMS growth rapidly stepped down, moving from single digits to near stagnation this quarter. If Temu's cross-border business is suppressed by tariffs, and competition in the domestic advertising market is also intensifying, then the low growth of OMS may not just be pressure for one quarter, but a structural signal that requires continuous tracking.
The +20% in transaction services is indeed real, but how much of it comes from increased monetization rates in China and how much from Temu's model shift cannot be directly answered, as PDD does not break down domestic and international data. This is the biggest data black box of this quarter.
Systematic Step-Down in Revenue Growth: Is This Now a Company with 10% Growth?
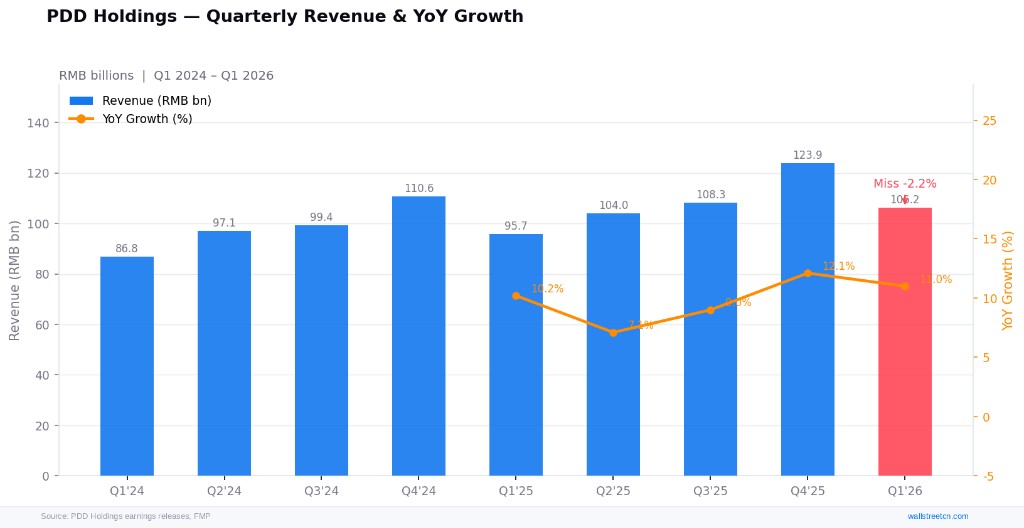
Figure 2: Quarterly revenue and YoY growth rate—growth has stepped down from the 30-40% range, stabilizing in the 10-12% range over the last three quarters
PDD experienced a dizzying period of high-speed growth in 2022-2023, with revenue growth once exceeding 40%. However, starting from the end of 2024, growth began to systematically narrow: Q1 2025 was 10.2%, Q2 dropped to 7.1%, Q3 rebounded to 9%, Q4 bounced back to 12.1%, and Q1 2026 was 11%.
Looking at the last four quarters, growth has stabilized within the 7-12% range, neither accelerating again nor stepping down further. This looks more like the growth characteristics of a mature platform rather than a company still in a rapid expansion phase.
There are several contextual dimensions worth noting. PDD's fiscal Q1 has historically been the seasonally weakest quarter of the year, with Q4 being the revenue peak, so the 14.3% quarter-on-quarter decline in Q1 is normal seasonality and does not constitute a trend signal. After gross margin declined from 62.3% to 55.9% over six consecutive quarters, it has stabilized in the 55-57% range over the last three quarters, with downward momentum significantly weakening, possibly nearing the bottom of this cycle of rising costs. R&D expenses increased by 23.5% year-on-year to RMB 4.4 billion, growing significantly faster than revenue, indicating that management is still continuously increasing investment in supply chain and technology.
Two-Year Drift in Analyst Ratings: How Consensus Has Shifted
If you look at the distribution of analyst ratings in October 2024, you will find an almost unanimous bullish camp: 48 positive ratings, 3 neutral, and 0 negative. After the May 2026 financial report: 17 positive ratings, 10 neutral, and 1 negative. Within two years, positive ratings shrunk from 48 to 17. This is not a reaction to a single financial report, but a consensus shift process that has lasted about eight quarters.
The positions of the three major banks after the report did not differ greatly, but their focuses varied. Goldman Sachs maintained its Buy rating and $145 target price, judging the non-operating floating losses as one-off and the operational improvement as real, characterizing the first-party brand business as "the most significant strategic shift in history"; Morgan Stanley maintained its Overweight rating and $129 target price, emphasizing the leverage in sales expenses and the improvement in transaction service monetization; JPMorgan maintained its Neutral rating and $110 target price, focusing on the unquantified impact of Temu tariffs and insufficient transparency in non-operating items, believing that 1-2 quarters of data are needed for verification.
These three positions reflect the core divergence in the current market regarding PDD: bulls are calculating operational improvements, while bears are asking all questions beyond the operational level.
100 Billion and "Rebuilding PDD": What Is Being Bet On This Time
The most noteworthy part of this quarter's report, deserving a separate chapter, is these few sentences.
Zhao Jiazhen stated in the report and conference call: "Supply chain investment will be our core strategic priority. We will invest significant resources to build a first-party brand business, creating new opportunities for supply chain partners and delivering exceptional value to users." Liu Jun added: "We are ready for long-term investment." The initial commitment is RMB 15 billion, with a cumulative three-year commitment of approximately RMB 100 billion.
"First-party brand business" appears for the first time in PDD's official financial report language. To understand the weight of this matter, one must first understand that PDD's historical business model was essentially a "connector"—connecting consumers with purchasing needs to factories/dealers with products, where the platform only collects channel fees, does not touch inventory, does not build brands, and does not manage manufacturing. The advantage of this model is asset-light and high profit margins, but the disadvantage is no control over the supply chain.
"Self-operated brands" mean that PDD is transforming from a connector to a participant: cooperating directly with factories, using platform data to define product specifications, incubating brands under the platform's name, and keeping supply chain profits on the platform side rather than letting them go to intermediaries. Analysts at Goldman Sachs liken this move to Amazon's path of creating its own brand, AmazonBasics—from platform matchmaking to vertical integration, this is a real expansion from known fields into unknown territory.
Of course, this RMB 100 billion is not free. Self-operated brands inevitably involve costs for direct procurement, warehousing, and logistics, leading to higher operating costs; brand building requires marketing investment, partially offsetting the cost-saving logic of sales expenses; and there is no historical data to reference for ROI. This is a strategic gamble, not a steady expansion with sufficient precedents. One of the core reasons for JPMorgan's neutral rating is precisely the belief that substantive GMV or monetization rate improvement data is needed to discount this RMB 100 billion commitment into a higher valuation.
Chen Lei used three words in the conference call: "deep transformation of business, deep transformation of internal processes, and deep transformation of organization." This is a rare and frank admission of entering uncertainty. A company operating normally does not need to say "deep transformation"—the choice of this word itself reveals management's internal judgment: the current path has reached its end, and a new start is needed.
Several Unresolved Questions
After this financial report, there are three questions that will need to wait until next quarter or longer for answers.
First, are the non-operating floating losses really one-off? The trend of other income/losses in the Q2 report is the most direct verification window. If it returns to normal, the RMB 6 billion swing can be corrected; if it remains negative, it indicates that the asset portfolio indeed has systemic problems.
Second, what substantial actions will the self-operated brand business take in its first year? Where will the initial RMB 15 billion investment go—to factory cooperation agreements, brand incubation systems, or a new APP/channel? Currently, behind the RMB 100 billion commitment, there is no flywheel already in motion, only the expression of management's will.
Third, what is the true state of Temu? It has been over a year since the US canceled the small package exemption policy. How much impact has Temu's US business suffered, and has it shifted from cross-border direct mail to a "local warehouse" model? The answer to this question may reflect the height of PDD's future growth ceiling more than the OMS growth rate—but PDD is under no obligation to answer, and indeed has not answered.
Risk Warning and Disclaimer
The market involves risks, and investment requires caution. This article does not constitute personal investment advice, nor does it consider the specific investment goals, financial status, or needs of individual users. Users should consider whether any opinions, views, or conclusions in this article align with their specific circumstances. Investment based on this is at your own risk.
