


PDD Q1 Revenue Rises 11% YoY to RMB 106.2 Billion, Adjusted EPS per ADS at RMB 9.51 | Earnings Watch
PDD's Q1 operating profit increased by 22% YoY to RMB 19.6 billion, with continuous improvement in core business profitability; however, net profit attributable to shareholders declined by 15% due to drag from non-operating items. A key shift occurred in the revenue structure: transaction service revenue surpassed advertising business for the first time, surging 20% YoY to RMB 56.3 billion to become the main growth engine. Management has clearly identified supply chain investment as the core strategy for the next decade
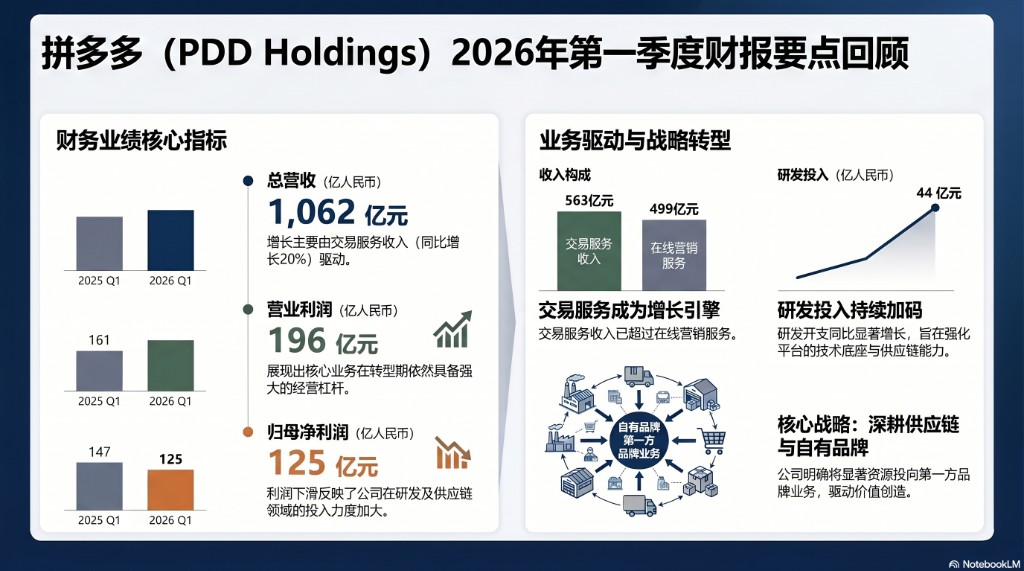
PDD proactively shifted gears in Q1, bringing its deep supply chain strategy to the forefront.
According to the latest earnings report released on Wednesday, PDD’s total revenue reached RMB 106.2 billion in Q1 2026, an 11% year-over-year increase, but fell short of the market expectation of RMB 108.6 billion. Non-GAAP net profit was RMB 14.1 billion, a 17% year-over-year decline, missing the expected RMB 24.6 billion. Non-GAAP earnings per ADS were RMB 9.51, compared to the market expectation of RMB 16.08. Following the earnings release, PDD’s US shares dropped nearly 4% in pre-market trading.
The real highlight lies not in the total figures, but in the structure. Transaction service revenue surged 20% YoY to RMB 56.3 billion, becoming the strongest growth engine and indicating that the platform's transaction volume is still expanding. However, online marketing service revenue grew only slightly by 2.5% to RMB 49.9 billion, nearly stagnating.
The profit side shows clear structural divergence. Operating profit jumped 22% YoY to RMB 19.6 billion, demonstrating that the operational leverage of the core business remains strong. However, dragged down by non-operating items such as negative investment returns and foreign exchange losses, net profit attributable to shareholders fell 15% YoY to RMB 12.5 billion. More notably, R&D expenses increased by 23% YoY to RMB 4.4 billion, a growth rate significantly higher than that of revenue, indicating that the company is actively sacrificing short-term profits to build long-term capabilities.
In the earnings report, management rarely declared a strategic shift with such high consistency—from the Co-CEOs to the Vice President of Finance, three executives all defined "deepening supply chain investment" as the core priority for the next ten years, explicitly stating that significant resources would be invested in building proprietary brand businesses. This means that PDD is switching from the high-growth phase of "traffic monetization" to a new cycle of "heavy supply chain investment," where short-term profit pressure may become the norm.
Nevertheless, PDD’s ammunition remains ample. Cash, cash equivalents, and short-term investments totaled RMB 436.1 billion at the end of the period, while operating cash flow slightly increased YoY to RMB 16.4 billion, providing sufficient financial depth for this long-term transformation.
Revenue Structure: Transaction Services Take the Lead, Advertising Growth Slows
Among the total revenue of RMB 106.2 billion this quarter, the two major business segments showed significant divergence.
Transaction service revenue reached RMB 56.3 billion, a 20% YoY increase, raising its share of total revenue to 53%. It has officially surpassed advertising to become the largest source of income. This trend aligns closely with the company's increased layout in self-operated and supply chain businesses, reflecting a strategic shift in focus from an "advertising platform" to a "transaction platform."
Online marketing services and other income amounted to RMB 49.9 billion, growing only about 2.5% YoY, a significant slowdown in growth rate. This figure reflects that against the backdrop of saturating traffic dividends and a complex macroeconomic environment merchants' willingness to advertise has become conservative, leading to a marginal narrowing of the platform's advertising monetization space.
Costs and Expenses: R&D Investment Accelerates, Fulfillment Costs Rise Simultaneously
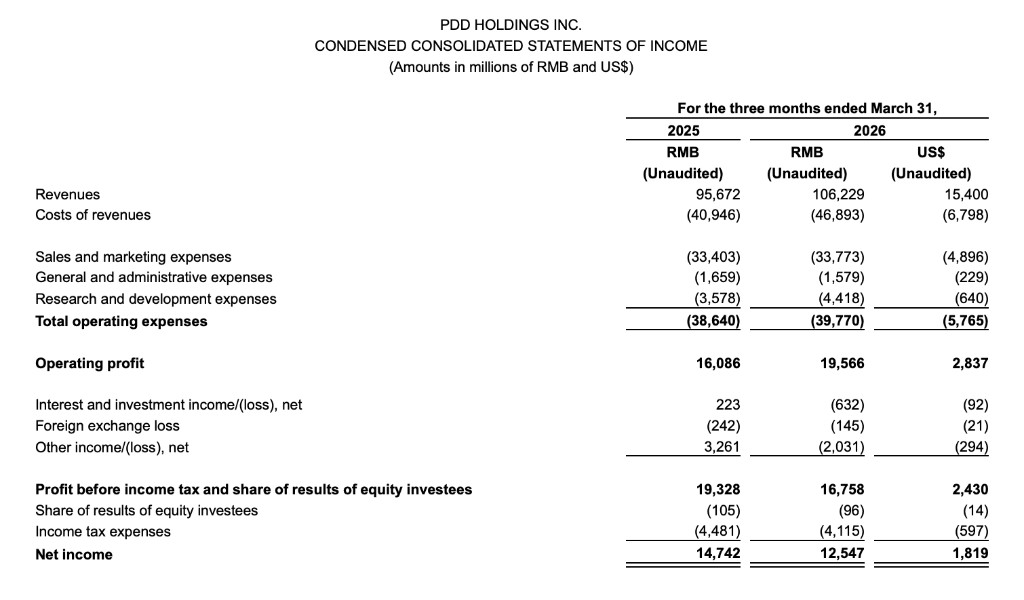
Cost of revenue increased by 15% YoY to RMB 46.9 billion, growing faster than revenue. The main drivers included simultaneous rises in fulfillment expenses, bandwidth and server costs, and payment processing fees. This is consistent with the company's strategic direction of increasing investment in supply chain and self-operated businesses, and this trend is expected to continue in the coming quarters.
Total operating expenses were RMB 39.8 billion, a YoY increase of about 3%. Breaking it down:
- Sales and marketing expenses: RMB 33.8 billion, basically flat compared to the same period last year (RMB 33.4 billion), showing that the company remained restrained in traffic acquisition spending and did not blindly increase investments.
- General and administrative expenses: RMB 1.6 billion, slightly decreased YoY, demonstrating significant effectiveness in cost control.
- R&D expenses: RMB 4.4 billion, a YoY increase of about 23%, the fastest growth among the three expense categories. Combined with management's statements on technology and supply chain capability building, this trend indicates that the company is consciously tilting resources toward technological R&D to accumulate strength for long-term competitiveness.
Notably, share-based compensation expenses totaled RMB 1.5 billion this quarter, a nearly 30% YoY decrease (RMB 2.2 billion in the same period last year). This to some extent reduced the magnitude of Non-GAAP adjustments and also reflects phased changes in the company's compensation structure.
Core Business Profitability Improves
Under GAAP standards, operating profit for the quarter reached RMB 19.6 billion, a 22% YoY increase. The operating profit margin was approximately 18.4%, an increase of about 1.6 percentage points YoY, indicating that the profitability of the core business has actually improved.
However, items below operating profit exerted significant pressure on the final net profit:
- Interest and investment income: Shifted from a profit of RMB 223 million in the same period last year to a loss of RMB 632 million, reflecting the impact of investment market volatility on asset allocation.
- Net other income: Plunged from a positive contribution of RMB 3.261 billion in the same period last year to a loss of RMB 2.031 billion. The reversal magnitude exceeded RMB 5 billion, making it the core reason for the decline in net profit.
- Foreign exchange losses: RMB 145 million, narrower than the same period last year (RMB 242 million).
Combining the impact of the above non-operating items, profit before tax dropped to RMB 16.8 billion. After adding income tax expenses of RMB 4.1 billion, the final net profit attributable to shareholders was RMB 12.5 billion, a 15% YoY decline.
Management Signals: Supply Chain Investment is the Biggest Variable for the "Next Decade"
The most worthy part of this earnings report for deep reading is not the numbers themselves, but the strategic signals conveyed by management's statements. Both Co-CEOs and the Vice President of Finance unanimously emphasized "supply chain investment" in their respective remarks, characterizing it as a "core strategic priority" and the "cornerstone of the platform ecosystem's resilience."
The company explicitly stated that it will invest significant resources in building its proprietary brand business (First-party Brand Business), meaning that PDD is moving beyond the pure third-party platform model and extending deeper into the industrial chain. This strategic shift inevitably brings sacrifices in short-term profit margins—rising costs, increased R&D, and potential expansion of capital expenditures—but it also indicates that the company is building higher competitive barriers and stronger long-term value creation capabilities.
