US Consumers Can't Stand High Oil Prices Anymore!
Barclays credit card data shows that US consumers' fuel demand has begun to shrink due to soaring oil prices triggered by the Iran-US war. In the past 30 days, fuel purchases have decreased by 8% year-on-year, with both refueling frequency and per-gallon volume declining. Although official EIA data has not yet reflected this turning point, high-frequency financial data has already revealed the suppressing effect of high oil prices on terminal spending, indicating that the resilience of US consumption is facing severe challenges
High oil prices are creating a rift in US fuel consumption. Barclays' latest research report, based on its proprietary credit card transaction data, reveals early signs of shrinking consumer fuel demand in the United States—both refueling frequency and per-gallon volume are declining, and the suppressing effect of high oil prices on terminal consumption is gradually becoming apparent.
According to "Chase the Wind Trading Desk," an analysis by Barclays on March 7th based on Barclaycard credit card data shows that in a rolling 30-day period, the total gallons of fuel purchased by US consumers decreased by 8% year-on-year. Although total fuel expenditure increased by 13% year-on-year, driven by an average oil price increase of 23%, the reduction in consumption volume cannot be masked by price factors. Calculated using AAA's national average price for regular unleaded gasoline, the current year-on-year price increase has reached 27%, exceeding the 23% in the past 30 days, implying further downward pressure on future consumption volumes.
Barclays analysts point out that the aforementioned trend began to emerge in the first week after the outbreak of the Iran-US war and the subsequent surge in oil prices. By the fourth week of the war, total fuel consumption had officially turned into a year-on-year decline. This high-frequency credit card data, revealing signals of demand contraction, holds significant reference value for judging commodity trends and consumer resilience.
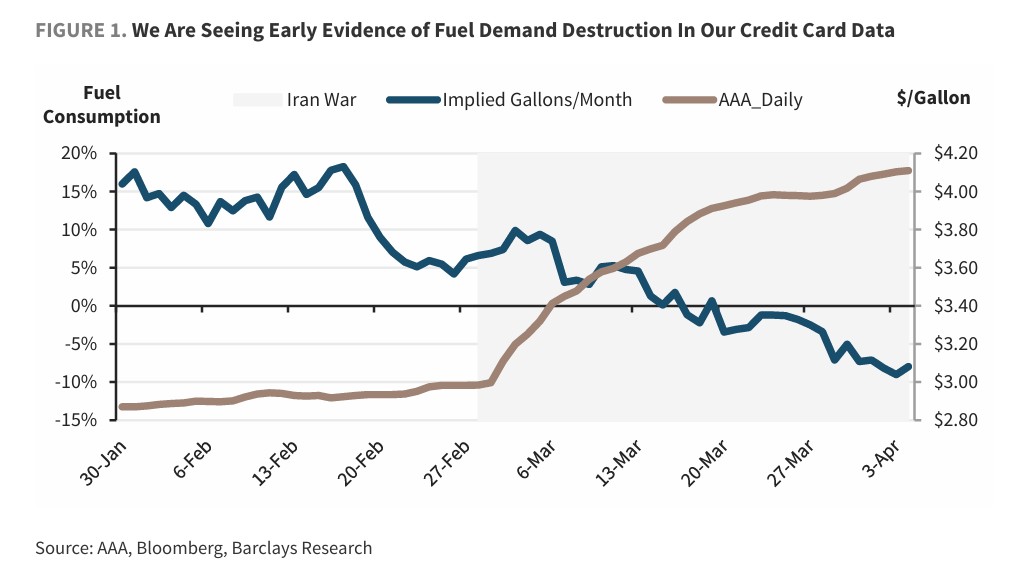
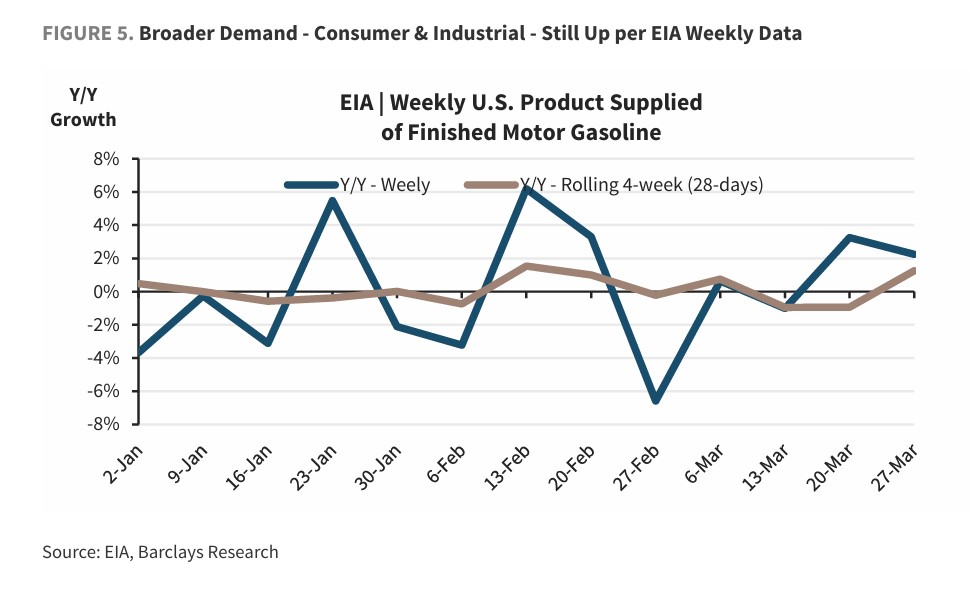
Notably, the US Energy Information Administration (EIA)'s official weekly data as of March 27th still shows a 1% year-on-year increase in gasoline demand in a four-week rolling average, remaining flat from the outbreak of the war in late February, and has not yet reflected a significant slowdown in demand. The divergence between these two sets of data highlights the leading advantage of high-frequency credit card data in capturing demand turning points.
Dual Contraction: Refueling Frequency and Per-Transaction Volume Decline Simultaneously
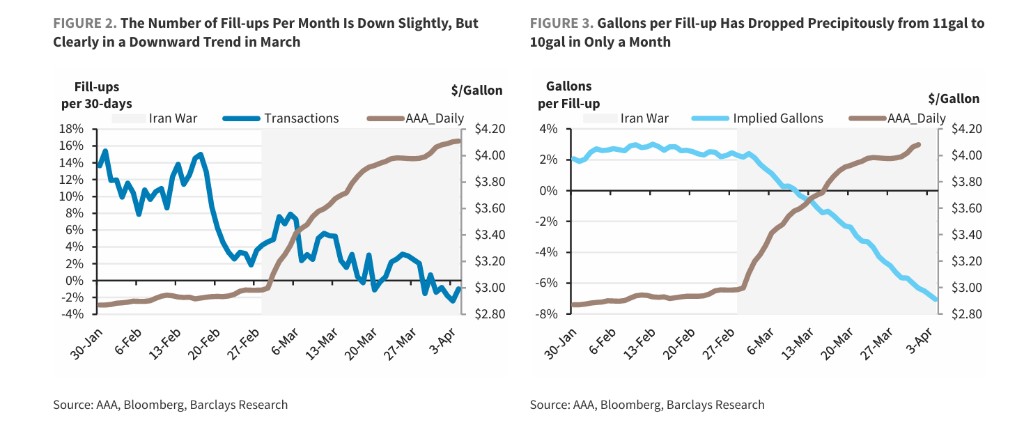
The decrease in fuel consumption is driven by two channels: fewer refueling instances and less fuel added per instance.
In terms of refueling frequency, the number of refueling instances per user decreased by approximately 1% year-on-year in the past 30 days. Although the decline is small, it has shown a clear downward trend since the first week of the war. Historically, US consumers refuel an average of about 3.5 times per month, roughly once every week to week and a half.
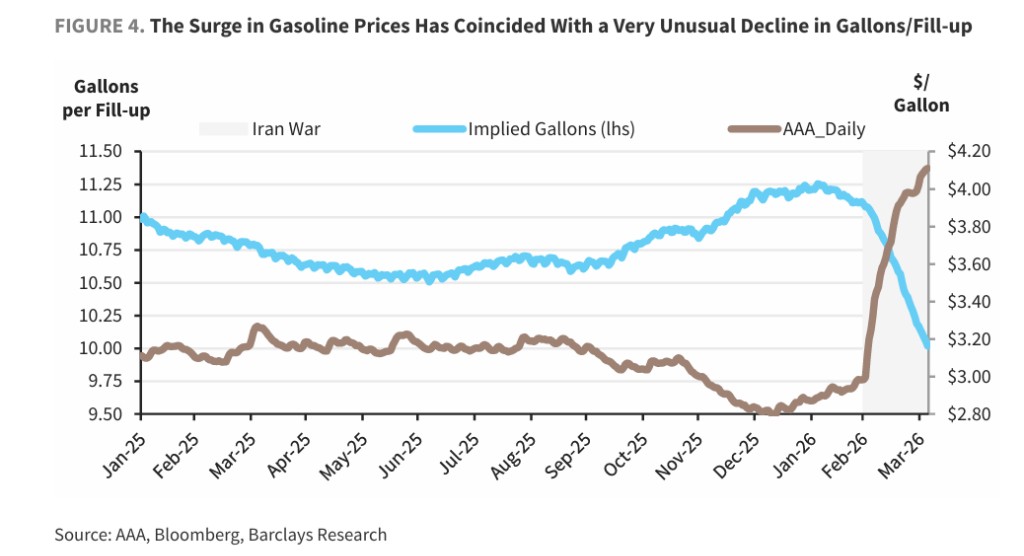
The change in per-transaction volume is more striking. The volume implied per transaction has dropped from a historically stable average of about 11 gallons to about 10 gallons, a year-on-year decrease of 7%. Barclays notes that this is an extremely unusual change in historical data and represents the most direct behavioral response of consumers to high oil prices—choosing to refuel less each time to control individual expenditure, under relatively inelastic travel demand.
An abnormal phenomenon of increased refueling frequency was briefly observed in the early stages of the war. Analysts suggest this might be due to some consumers anticipating further oil price hikes and opting to "fill up" in advance to avoid rising costs. However, as the war continued, this effect gradually subsided, and refueling frequency steadily declined and turned negative year-on-year. Combining these two metrics, Barclays believes there is sufficient evidence to constitute early signs of US consumers cutting back on fuel consumption.
Price Elasticity Calculation: Theoretical Forecasts Suggest Further Downside Potential for Demand
Barclays' commodities research team conducted a quantitative analysis of the price elasticity of US gasoline demand, breaking it down into "driving mileage effect" and "fuel economy effect."
Multifactor model analysis indicates that for every 10% increase in oil prices, driving mileage will decrease by approximately 0.25% (elasticity coefficient of approximately -0.025); after controlling for driving mileage, every 10% increase in oil prices will further reduce gasoline consumption by about 0.45% (elasticity coefficient of approximately -0.045). Combined, the comprehensive price elasticity of US gasoline demand is approximately -0.7% (meaning a 10% increase in oil prices leads to a 0.7% decrease in demand).
Based on this, it is estimated that since the outbreak of the Iran-US war, oil prices have cumulatively risen by about 40%, theoretically corresponding to a combined decrease of about 3% in gasoline demand from consumers and industry. However, EIA data as of March 27th shows that demand in a four-week rolling average still increased by 1% year-on-year, failing to confirm the aforementioned downward forecast.
Analysts also caution that if high oil prices lead to a broader cooling of economic activity, the actual impact of price elasticity could be further amplified, with the risk of demand falling more than the model predicts.
Data Methodology: A High-Frequency Analysis Framework Supported by Millions of Transactions
The Barclaycard proprietary credit card data used in this analysis covers millions of active users and includes billions of transaction records, with historical data tracing back over a decade. The analysis primarily targets transactions with merchant category codes (MCC) for "Automated Fuel Dispensers" and "Gasoline Stations," encompassing both self-service and pay-at-the-counter scenarios.
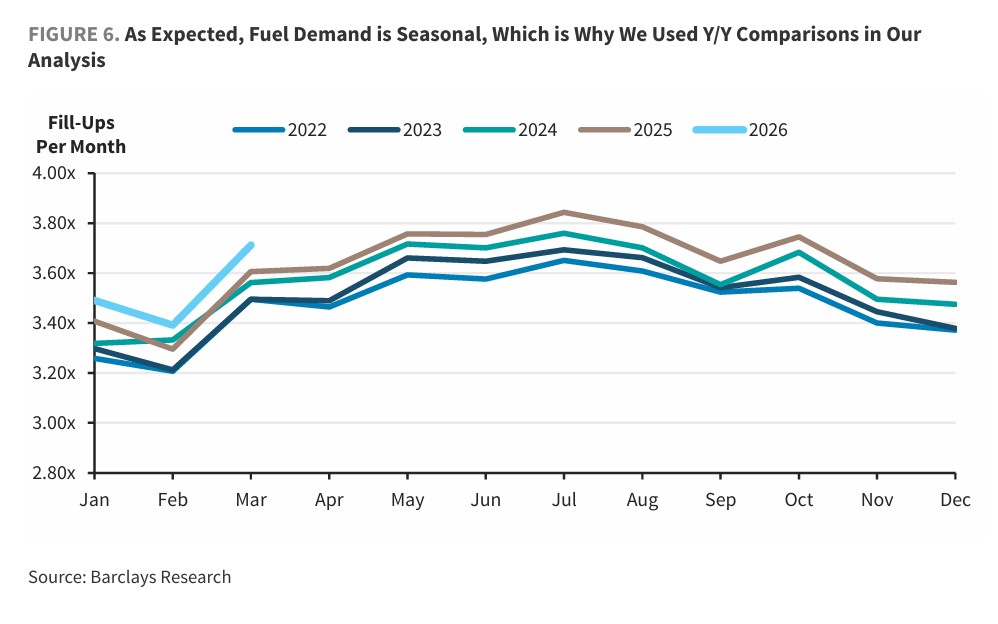
Since credit card transaction data records only the transaction amount rather than the actual gallons purchased, Barclays infers consumption volume through total expenditure and AAA's average retail oil prices. To eliminate seasonal factors—especially fluctuations during the transition from winter to the summer driving season—the analysis uses year-on-year comparisons.
As a reasonableness check, Barclays' calculated historical averages—approximately 11 gallons per refueling and about 3.5 times per month—combined with an average fuel efficiency of about 25 miles per gallon, translate to about 975 miles driven per month, or about 1.2 million miles annually. This is highly consistent with the US Federal Highway Administration's reported average annual mileage of about 1.35 million miles in 2022, validating the representativeness and reliability of this dataset.