
BoA's Hartnett: US Stocks Haven't Bottomed Yet; Trump May Be Forced to Launch 'Policy Rescue Package'
Bank of America's latest report: Market sentiment cools, sell signal ends, but no capitulation by longs or macroeconomic panic. Buy signal not yet triggered. Recent heavy selling in stocks and gold, with funds flowing into short-term bonds for safety. BoA expects policymakers to be forced to act to avoid recession, triggering 'panic easing,' and advises looking at oversold assets like gold and software
Bank of America's latest fund flow report shows that market sentiment has clearly cooled from extreme optimism, but key buy signals have not yet been triggered, and the time is not yet ripe for contrarian investors to enter.
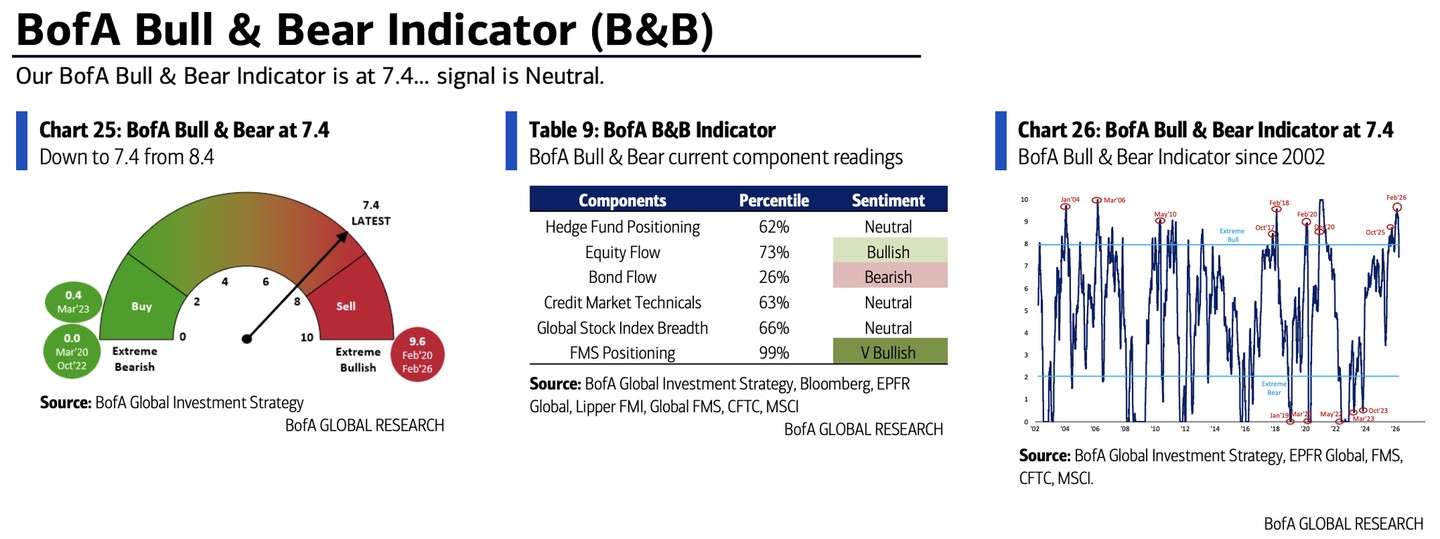
According to the "Chase the Wind" trading desk, Bank of America strategist Michael Hartnett stated in his latest report released on March 27th that the BoA Bull & Bear Indicator has dropped sharply from 8.4 to 7.4. Since the sell signal was issued on December 17th last year, the S&P 500 has fallen by 5%, with a maximum drawdown of 7% from peak to trough.
Although this sell signal has officially ended, BoA's multiple trading rules indicate that the current market has neither seen concentrated capitulation by longs nor macroeconomic panic (i.e., significant downward revisions to GDP and EPS forecasts), making the conditions for contrarian buying insufficient.
Bank of America believes that policymakers will be forced to take action to avoid a recession, thereby triggering 'panic easing.' Additionally, once the Middle East conflict is resolved, Trump may push for measures to protect American consumers from recession and consolidate his support among voters.
Bull & Bear Indicator Retreats, Sell Signal Ends but Buy Signal Absent
The Bank of America Bull & Bear Indicator this week dropped sharply from 8.4 to 7.4, the lowest level since July 2025, mainly dragged down by the deterioration of global equity index breadth, outflows from high-yield bonds and emerging market bonds, and widening credit spreads.
This indicator previously triggered a sell signal on December 17th, when the reading was above 8.0. Since then, the S&P 500 has fallen by 5%, with a peak drawdown of up to 7%.
According to Bank of America's historical statistics from 32 sell signal endings since 2002, the S&P 500 and MSCI World Index averaged only a 1% return in the subsequent three months, lacking strong rebound appeal.
Compared to previous market bottoms, the current indicator reading remains significantly high. During the "equivalent tariffs" sell-off in April 2025, the indicator fell to 3.4; during the most panicked period of the COVID-19 pandemic in 2020, it briefly reached 0.0, far from the extreme levels seen at historical market bottoms.
Global Breadth Rule: Further Decline Still Needed to Trigger Buy Signal
Bank of America believes that the indicator most likely to trigger a buy signal first is the "Global Breadth Rule"—when 88% of global stock indices simultaneously fall below their 50-day and 200-day moving averages, this rule will issue a buy signal.
The current reading for this indicator is -16%, and it briefly touched -39% on Monday (March 23rd) before recovering slightly. According to BoA's calculations, to trigger a buy signal, Asia-Pacific stocks need to fall by approximately another 2%, emerging market stocks by another 3%, and Latin American stocks by about 14%.
Other indicators have also not yet reached the buy threshold: the global fund manager survey cash position is 4.3%, with a buy threshold of 5.0%; the global flow trading rule requires global equities and high-yield bonds to have outflows exceeding 1% of assets under management over four weeks to trigger a signal, with the current reading only at -0.8%.
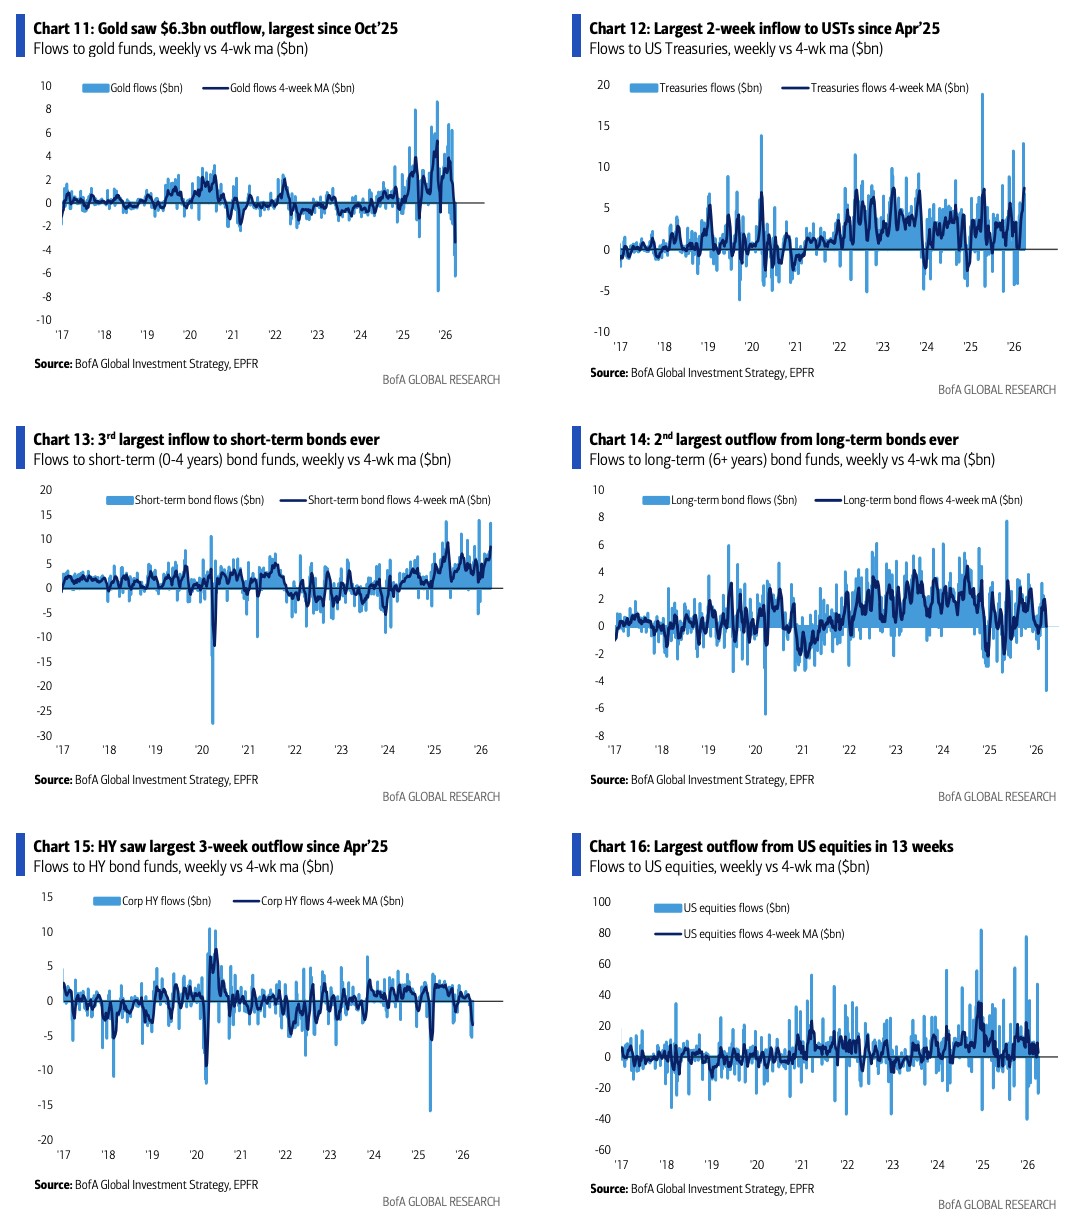
Mass Exodus: Stocks, High-Yield Bonds, and Gold All See Net Outflows
This week's fund flows showed a clear risk-aversion characteristic. U.S. stocks saw an outflow of $23.5 billion for the week, the largest in nearly 13 weeks; European stocks saw an outflow of $3.1 billion, the largest weekly outflow since April 2025; the materials sector saw an outflow of $10.5 billion, a record high.
High-yield bonds have experienced net outflows for five consecutive weeks, with an outflow of $3.3 billion this week, totaling $13.5 billion in three weeks, the largest three-week outflow since April 2025. Gold funds saw a net outflow of $6.3 billion this week, the largest weekly outflow since October 2025.
Funds mainly flowed into short-term fixed-income assets: U.S. Treasury bonds saw an inflow of $6.8 billion this week, totaling $19.7 billion in two weeks, the largest two-week inflow since April 2025; short-term bonds (with maturities of less than 4 years) saw a weekly inflow of $13.3 billion, the third largest weekly inflow on record.
In contrast, long-term bonds (with maturities of 6 years or more) saw an outflow of $4.7 billion this week, the largest since March 2020 and the second largest weekly outflow on record.
BoA's Basic Judgment: Policy Panic Imminent, Await Better Buying Opportunity
Synthesizing various indicators, Bank of America's basic judgment is: policymakers will be forced to take action to avoid a recession, thereby triggering 'panic easing.'
However, before that, the market may continue to experience a wide range of fluctuations—this wide range began from the peak liquidity in October-November last year, the peak optimism for AI capital expenditures, and Trump's election losses in New York, New Jersey, and the Virgin Islands. BoA believes this pattern is likely to continue until the midterm elections in mid-November 2026.
Bank of America strategists advise that there is no need to rush to enter the market at this stage, nor should one be greedy and chase rallies.
Against the backdrop of a bear market in the dollar and a global trend of fiscal expansion, opportunities for gold bulls are expected to gradually return. Meanwhile, Bank of America believes that software, private equity, and consumer finance are the most contrarian long directions for Q2—these assets are currently in an oversold region relative to their 50-day and 200-day moving averages.
