
CICC: The "narrative" and reality of deposit migration

中金报告探讨了存款搬家的趋势与市场误读,指出 “天量” 存款到期并不等同于居民储蓄的全部,强调需考虑理财产品的影响。报告分析了 2022-2023 年居民存款的高增长及其原因,认为超额储蓄的概念更为重要,并预测 2025 年居民储蓄倾向仍高,显示风险偏好未显著变化。
存款搬家的叙事与现实
我们在 2025 年 8 月的报告《居民存款搬家潜力几何》中提示了存款搬家的趋势,今年年初天量存款到期和搬家再度成为市场上涨下的新 “叙事”,然而我们观察到市场对此存在一些常见疑问甚至误读,例如:“天量” 存款到期意味着什么?为何市场测算规模迥异?为何搬家的 “宏大叙事” 与微观体感不符?存款搬家流向哪里?本轮与之前有何异同?等等。本篇报告我们对这些问题进行探讨,特别是厘清 7 个市场常见认知误区。
1.居民储蓄≠存款
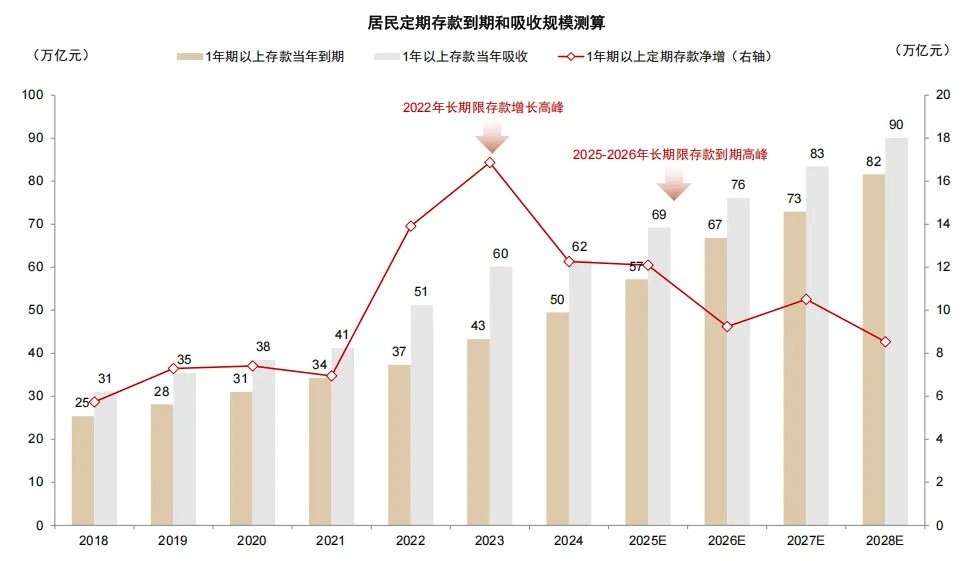
“天量” 存款到期 “叙事” 的来龙去脉。市场对 “天量” 存款到期的讨论实际上可以追溯到 2022-2023 年的居民长期限存款的高增长:当时两年居民存款净增 28 万亿元,相比 2021 年的水平形成约 5 万亿元的长期限 “超额存款”,这一部分存款在 2025-2026 年陆续到期。但我们认为存款并非居民储蓄的唯一形式,居民储蓄应同时将存款和银行理财产品纳入考虑范围。实际上,2022-2023 年的存款高增长实际上主要由于理财的再配置,当时由于债市利率迅速上行导致理财产品出现净值回撤和赎回的 “负反馈”。因此,我们认为这一部分 “超额存款” 的性质上与理财产品近似,主要在低风险偏好资产中进行配置切换。
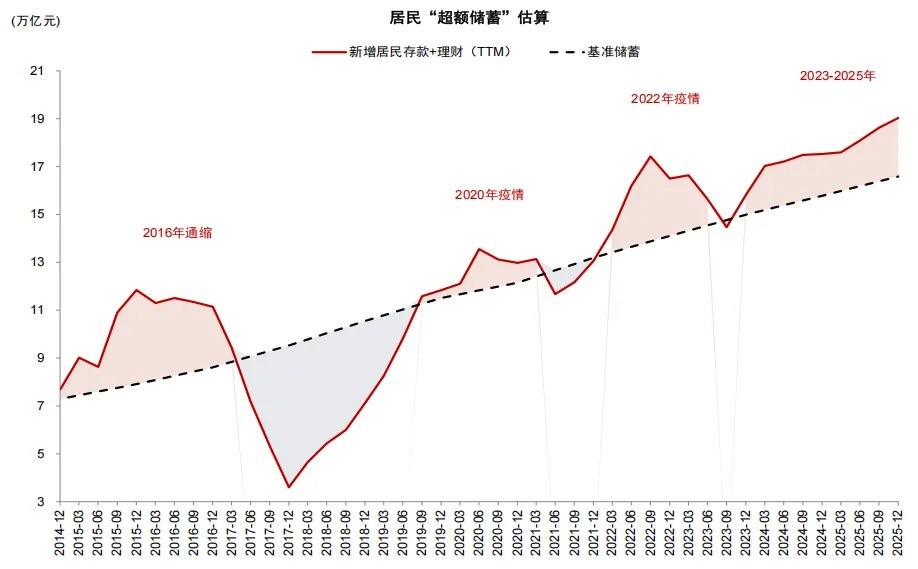
如何衡量存款搬家的潜力?相比市场关注的存款到期 “叙事”,我们认为综合考虑居民存款和理财的 “超额储蓄” 更为关键。我们使用每年居民储蓄/可支配收入测算储蓄率,将超出长期趋势水平的储蓄作为 “超额储蓄”。根据我们的测算,2022 年-2025 年期间居民共形成约 6 万亿元超额储蓄,并且 2025 年居民储蓄倾向仍然位于 21% 左右的高位,显示出虽然资本市场回暖,居民投资和消费的边际倾向总体上并未明显提升。因此,我们认为当前市场 “存款搬家” 叙事并不意味着居民风险偏好出现实质性变化,而更多的是在低利率环境下进行资产配置边际调整的行为。
图表 1:2026 年长期限居民存款到期源于 2022-2023 年的高增
注:根据上市银行公布存款到期日结构估算。
资料来源:Wind,中金公司研究部
图表 2:2021 年以来存款利率下调,长期限存款利率下调更多
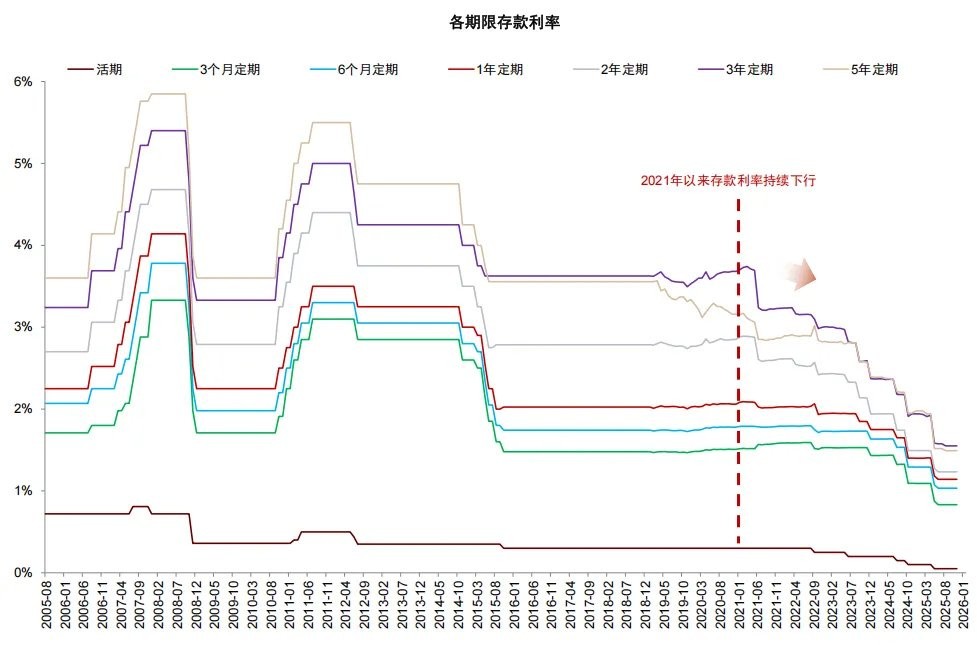
资料来源:融 360,上市公司公告,Wind,中金公司研究部
图表 3:2022-2023 年居民存款的高增长部分来自理财产品赎回
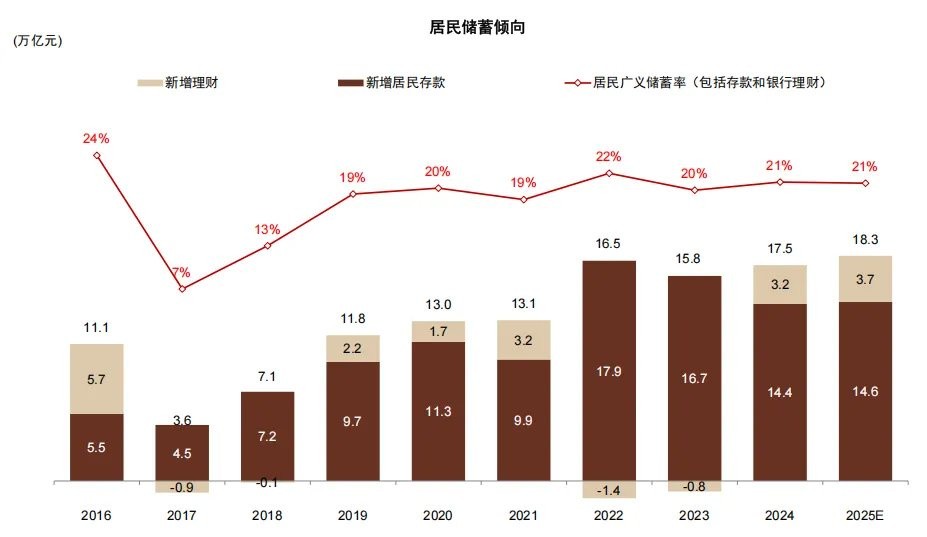
注:“超额储蓄” 定义为超出历史平均储蓄倾向的新增存款和理财规模
资料来源:Wind,中金公司研究部
图表 4:估算 2022-2025 年居民累积超额储蓄约 6 万亿元
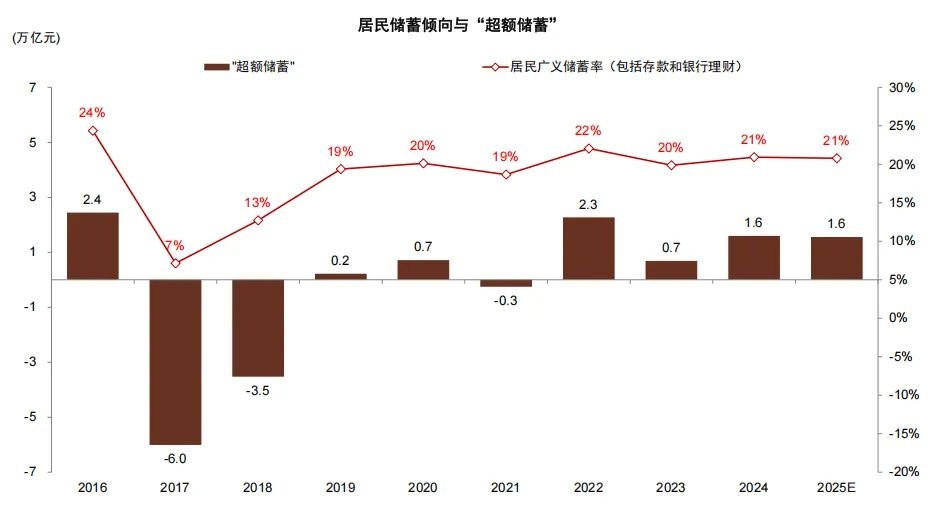
注:“超额储蓄” 定义为超出历史平均储蓄倾向的新增存款和理财规模
资料来源:Wind,中金公司研究部
2. 存款剩余期限≠存款合同期限
市场对定期存款到期规模和结构的估计,通常使用上市银行的存款到期日数据进行测算。但我们注意到这一测算存在两种常见偏差:
1.将全部存款而非居民存款作为测算范围。我们认为企事业单位存款主要用于经营周转和投资储备,具有流动性和收益稳定性的要求,投资范围较为局限,我们的测算仅包括居民定期存款。
2.将存款到期期限结构作为合同期限结构。由于部分长期限存款也在短期内到期,因此使用剩余期限估算存款到期结构低估了其中长期存款的占比。
我们综合考虑上述因素,测算居民定期存款 2026 年到期规模约 75 万亿元,其中 1 年期及以上存款到期约 67 万亿元,高于市场 50 万亿左右的测算;估算 2026 年居民全部和 1 年期以上定期存款到期相比 2025 年增长分别为 12% 和 17%,同比增加 8 万亿元和 10 万亿元。
图表 5:我们估算 2026 年居民定期存款到期约 75 万亿元
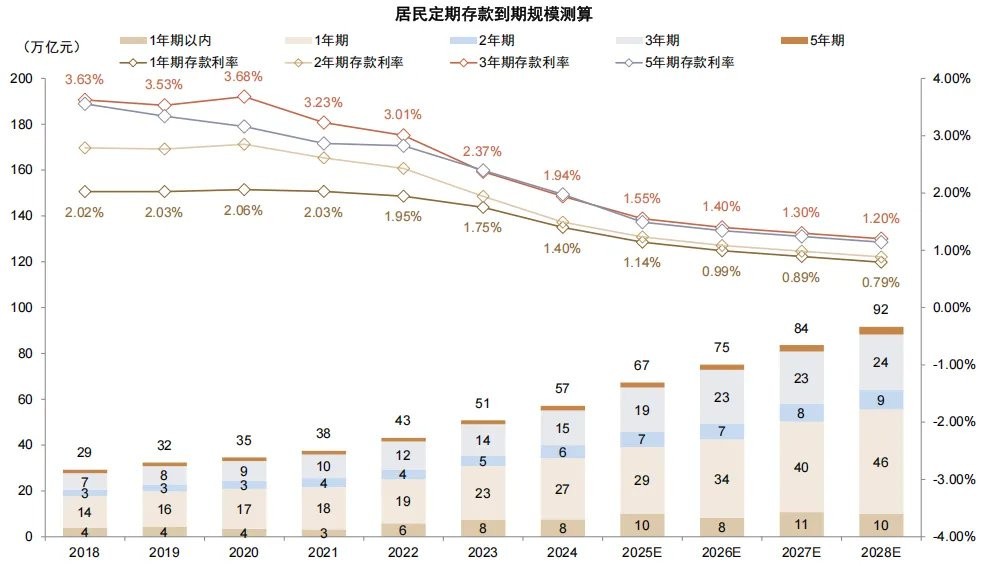
注:根据上市银行公布存款到期日结构估算。
资料来源:Wind,中金公司研究部
3.存款净增≠存款吸收
市场对定期存款到期估计的另一个常见偏差来源于将存款净增等同于存款吸收和到期,从而影响到期节奏的判断。例如,2022 年居民定期存款净增相比 2021 年增长 70%,但存款新吸收规模相比 2021 年仅增长 24%。类似地,一季度居民定期存款净增占全年约 60%,但从到期节奏来看,我们估算一季度占全年 40%,二三四季度各占约 20%,季末月份占比略高;估算 2026 年一季度居民 1 年期及以上定期存款到期规模为 29 万亿元,相比 2025 年同期增加约 4 万亿元。
图表 6:存款到期节奏相比存款净增更为均匀
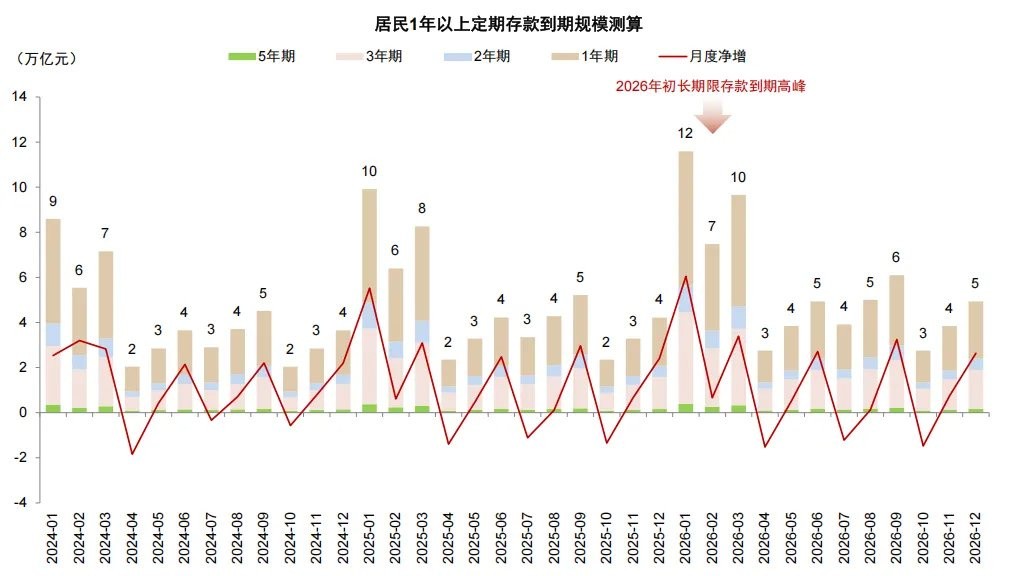
注:根据上市银行数据估算,2026 年数据为预测值
资料来源:上市公司公告,Wind,中金公司研究部
4. 存款到期≠存款搬家
存款到期也并不意味着存款搬家,实际上由于居民风险偏好具有稳定性,以及流动性管理的需求,绝大多数存款仍然停留在银行体系内。我们引入广义存款留存率的概念,通过 1-存款脱媒/(存款到期规模 + 活期存款余额)测算存款在银行体系的留存比例;金融脱媒由实体存款创造和实际净增的差额估算,代表实体存款向非银产品的净流动规模。测算结果显示,绝大多数年份银行存款留存率都在 90% 以上,个别年份例如 2024 年由于存款向理财产品和债券基金迁移,存款留存率下降到 93% 左右,2025 年存款留存率仍在 96% 的高位。近 5 年金融脱媒规模在 3-12 万亿元范围波动,代表 “存款搬家” 对于金融市场的实际影响规模。
图表 7:我们测算每年存款实际留存率在 90% 以上
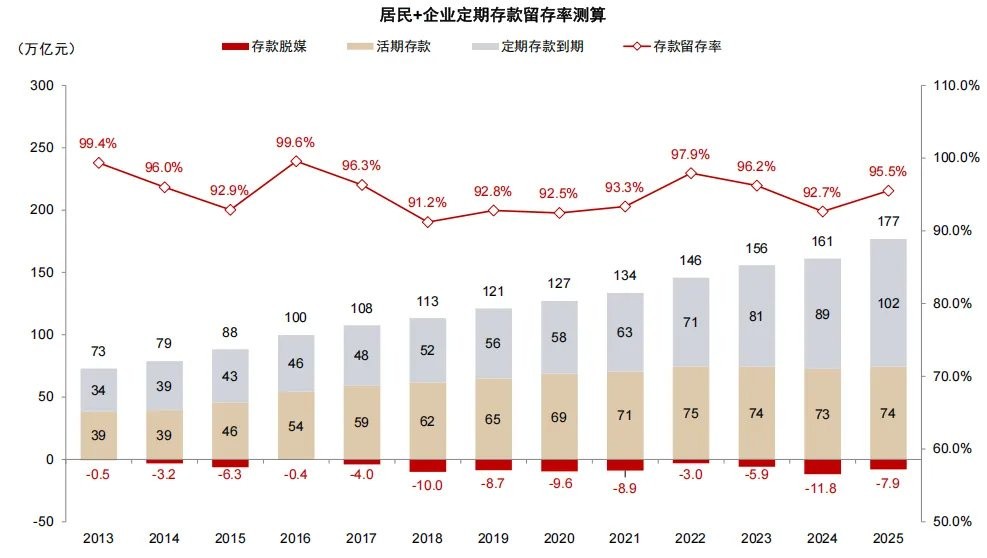
注:根据上市银行数据估算,2025 年数据为预测值;金融脱媒由实体存款创造和实际净增的差额估算;
资料来源:上市公司公告,Wind,中金公司研究部
5. 存款搬家≠存款入市
对于居民存款搬家的去向也较为多元,不仅是进入股市。我们认为主要包括以下方面:
1.消费:是居民存款的最主要去向,估算 2025 年居民可支配收入 61 万亿元,消费支出 53 万亿元 [1],消费占比约 68%,居民存款通过消费进入企业部门或回流居民部门;
2.购房:2025 年 1-11 月,全国住宅新房销售额约 7 万亿元,加上二手房销售(占比 45%[2])约 12 万亿元,估算其中现金支付约 7 万亿元;
3.贷款偿还:我们估算 2025 年居民偿还房贷约 5 万亿元,其中提前还贷 3 万亿元;
图表 8:我们估算 2025 年居民偿还房贷规模约 5 万亿元
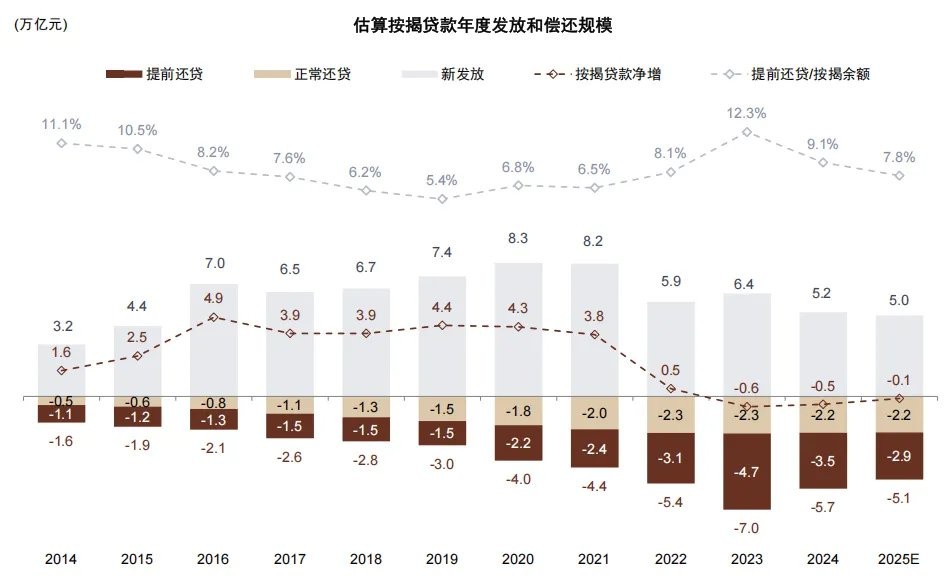
注:2025 年为预测数据,按揭发放和还贷规模根据住房销售额(包括二手房)、平均首付比例、按揭贷款余额变动等数据估算
资料来源:Wind,中金公司研究部
4.银行理财:与定期存款较为接近,收益略高于定期存款但存在波动,固收类理财近一年收益在 2.0% 左右,现金管理类理财流动性较好但收益率仅为 1.3% 左右。2025 年银行理财产品规模净增约 3.7 万亿元;
5.保险:2016 年 9 月监管规范 “万能险” 后高收益、高流动性的保险产品基本退出市场,目前主流寿险产品收益率约为 1.75% 保底 + 3.5%-3.75% 演示利率(受险企投资能力影响),收益率高于存款但流动性较低,提前支取可能损失本金。2025 年前 11 个月寿险保险收入累计约 3.4 万亿元。
图表 9:2025 年固收类金融产品增速下降,权益类金融产品增速回升
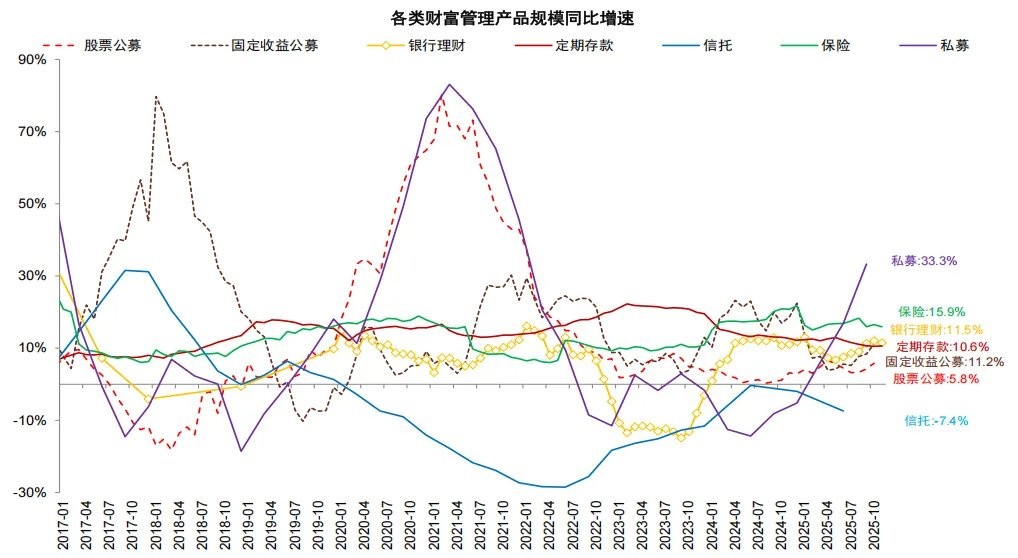
注:固收和股票公募基金规模为份额;私募仅包括证券投资基金;信托产品包括房地产和基建类资金信托
资料来源:Wind,中国人民银行,金融监管总局,中国理财网,信托业协会,基金业协会,中金公司研究部
6.公募股票基金:具有专业投资优势但波动较大,2025 年偏股型股票基金份额下降 1600 亿份,而被动指数型基金规模上升 6000 亿份,体现出指数化的趋势。
7.私募股票基金:2025 年证券投资类私募基金规模增长 1.8 万亿元,是增速最快的财富管理类别。部分量化私募基金在市场中性策略下可兼具回撤幅度较小和较高收益的优势,指数增强策略的收益率和波动性表现也通常好于市场,但投资门槛较高,适合高净值和风险偏好较高的投资者。
8.股市:收益空间大,但波动大,适合高风险偏好型投资者,2025 年前三季度券商保证金增加约 1 万亿元(包括机构资金)。尽管股市融资余额、成交额在 2024 年 9 月以来均有明显上升,但开户数量增长并不明显,体现出居民入市可能并不普遍。
图表 10:股市融资余额、成交额明显上升,但开户数量增长不明显
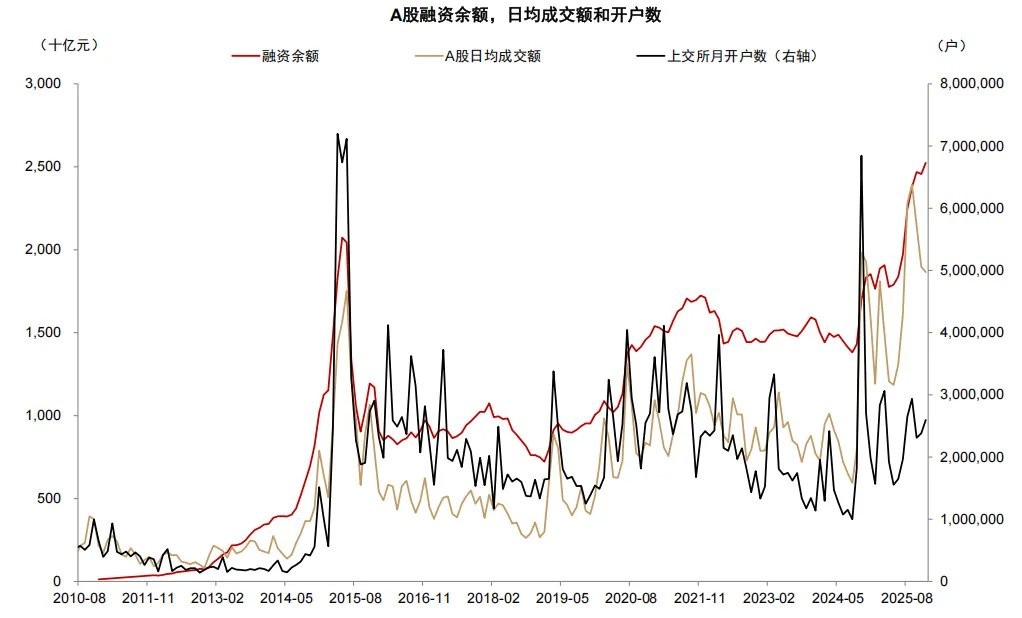
资料来源:Wind,中金公司研究部
综上所述,160 万亿元居民存款每年的主要去向是消费、购房和贷款偿还,每年用于金融资产配置的比例仅为存款的 6% 左右 [3],且以低风险偏好的理财和保险为主,按照新增券商保证金估算入市资金仅占存款的不到 1%;金融资产中增长较快的类别主要是私募基金、保险和银行理财,体现出资产重新配置的主体主要是风险偏好较高的高净值投资者,更普遍的大众客户存款搬家入市尚不明显。
图表 11:居民存款流向股市的渠道分析
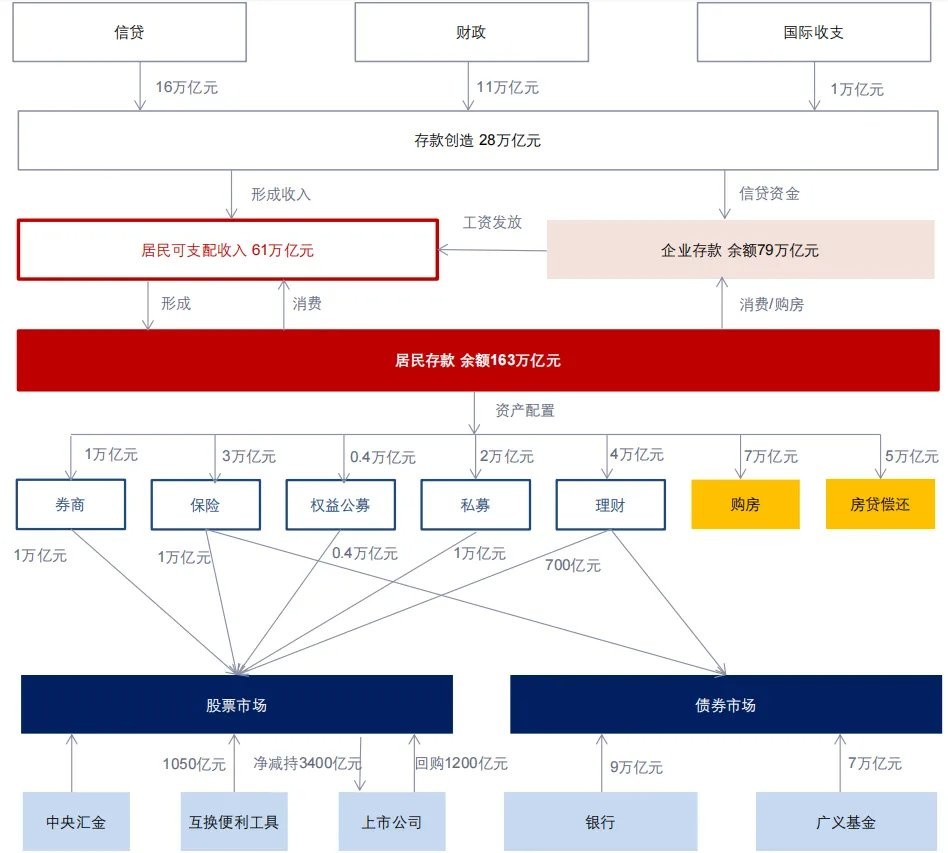
注:箭头指向数值指的都是流量数据;存款创造数据为 2024 年 12 月-2025 年 11 月;存款余额数据截至 2025 年 11 月;房贷偿还和购房使用 2025 年估算数据;存款进入券商数据使用 2025 年前三季度券商保证金数据;公募基金流入使用偏股型基金份额增长数据;保费收入仅包括寿险,假设流入权益比例 30%;私募基金假设 90% 进入股票市场。
资料来源: Wind,中国人民银行,金融监管总局,中国理财网,信托业协会,基金业协会,中金公司研究部
6. 非银存款增长≠存款入市
另一个市场常用的观察存款搬家进入股市的指标是非银存款的增长。我们观察到非银存款增长与股市表现存在相关性,但并非亦步亦趋,主要由于非银存款还受到其他因素的干扰。我们统计截至 2025 年 3 季度,上市券商保证金占非银存款的比例仅为 11% 左右,非银存款中占比最高的机构主要是银行理财(29%)、公募基金(15%)、财务公司(11%)、保险(9%)等;2025 年前三季度对非银存款增长贡献最主要的是银行理财(37%)而非券商保证金,主要由于理财在债市波动环境下,对于收益稳定的同业存款的偏好提升。尽管如此,非银存款作为能够较为高频监测存款搬家的指标仍有参考价值,但需要区分其影响因素。
图表 12:近年非银存款上升主要由于理财和公募基金配置
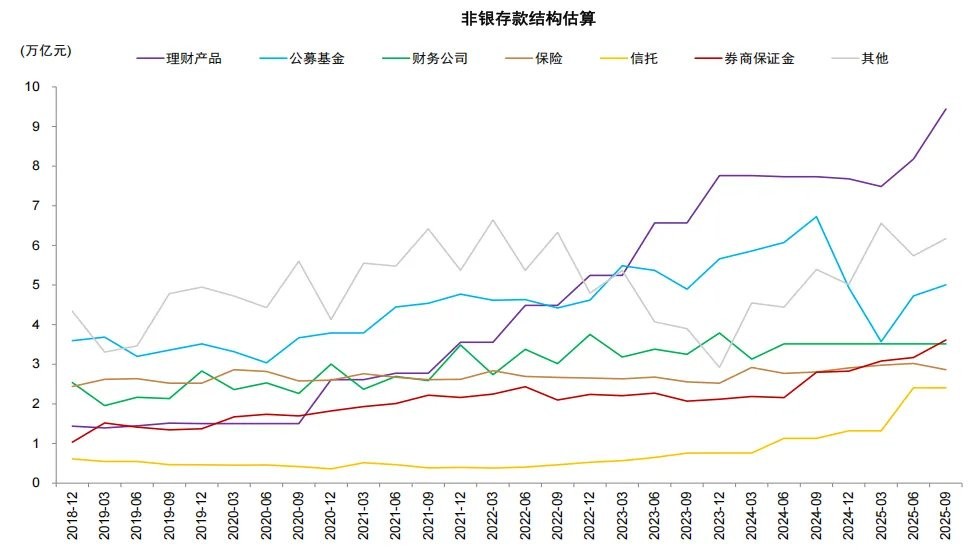
资料来源:上市公司公告,金融监管总局,信托业协会,中国理财网,Wind,中金公司研究部
7. 2026 年≠2017 年/2021 年
市场对存款搬家的期待也来自于历史经验的启示:2017 年和 2021 年作为典型的超额储蓄消耗、存款搬家进入股市的范例,是否能在 2026 年重现?我们认为 2026 年与 2017 年和 2021 年的相似之处在于,此前居民在低利率环境下积累了相当规模的超额储蓄,存款与市值比例处于相对高位。
图表 13:2017 年和 2021 年都出现过居民超额储蓄转负的现象
注:“超额储蓄” 定义为超出历史平均储蓄倾向(2016-2022 年)的新增存款和理财规模
资料来源:Wind,中金公司研究部
图表 14:存款/A 股市值比例处于较高位置为存款搬家奠定基础
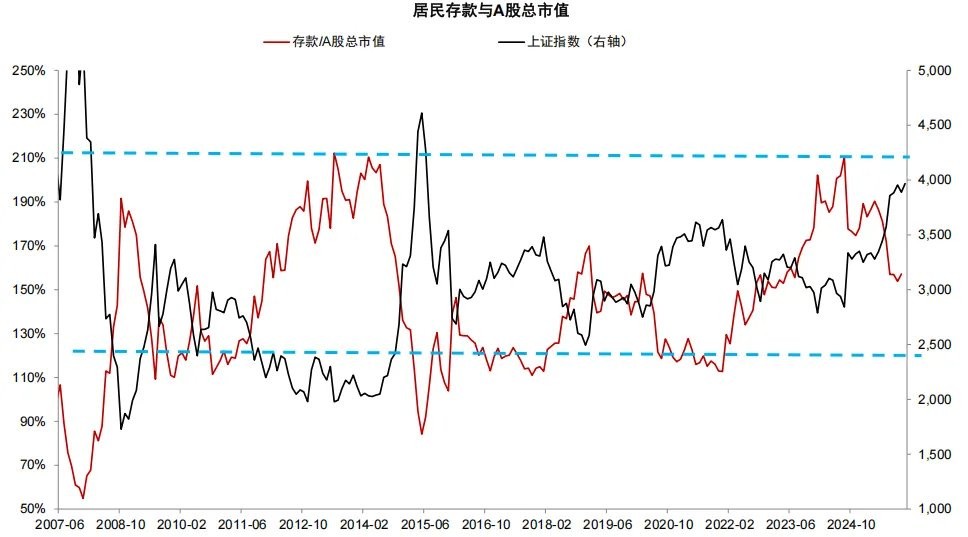
资料来源:Wind,上市公司公告,中金公司研究部
但本轮与上两轮的主要区别在于宏观和流动性环境的不同:
- 前两轮都出现 PPI 的明显回升和企业盈利的改善,而当前 PPI 增长尚未走出负区间;
图表 15:M1-M2 剪刀差近期有所回落
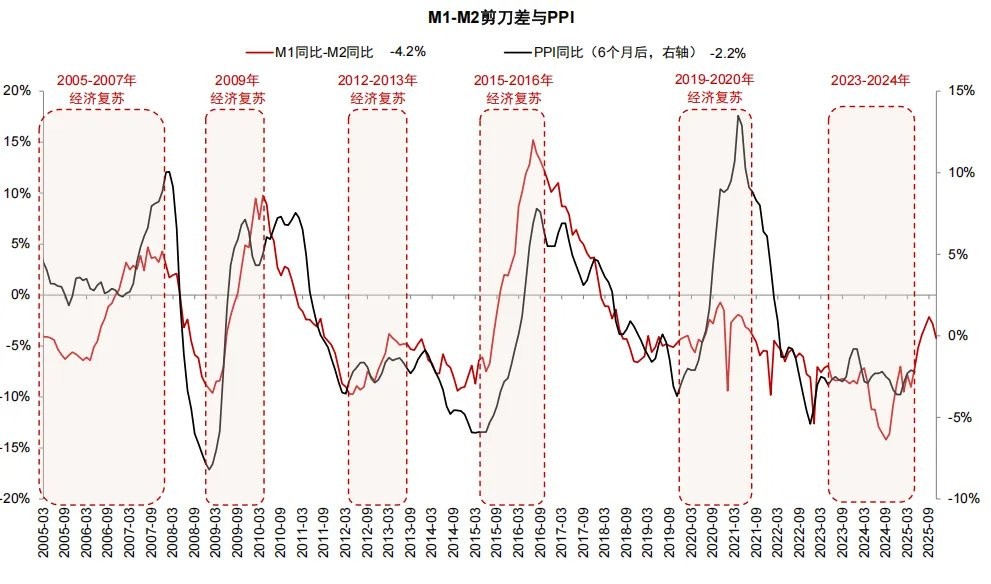
注:M1 数据使用旧口径
资料来源:中国人民银行,Wind,中金公司研究部
- 前两轮房地产市场均出现明显回暖,而本轮房地产市场供需矛盾仍然存在;
- 前两轮存款创造主要依靠信贷贡献,货币流通速度较高,M1 增速回升明显,而本轮存款创造中财政投放和企业结汇贡献上升,更多形成定期存款沉淀,M1 增速有所回升但绝对增速仍然低于定期存款。
图表 16:近年来财政和企业结汇对存款创造贡献提升,但信贷贡献下降
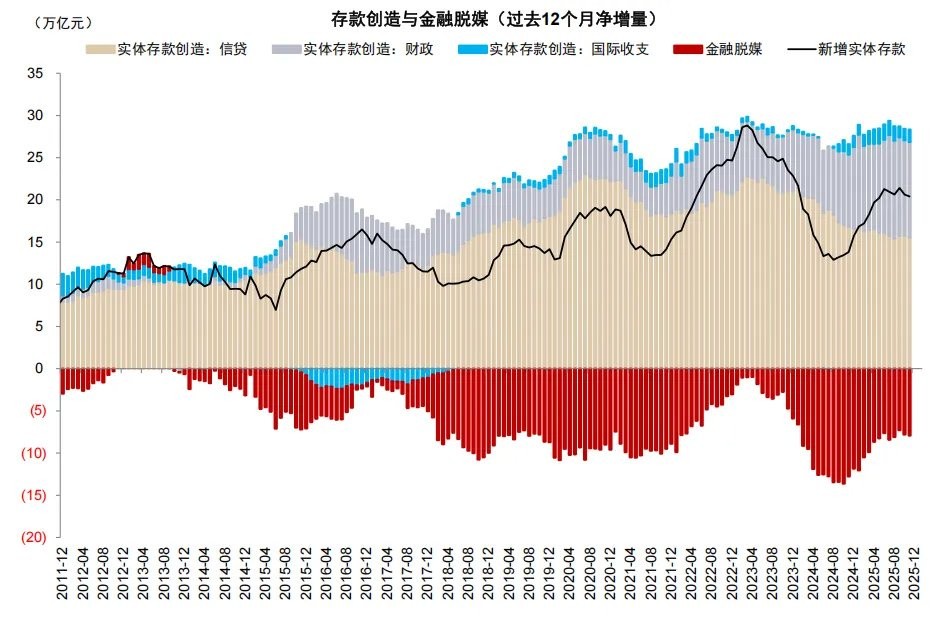
资料来源:中国人民银行,Wind,中金公司研究部
- 前两轮股市上涨中外资处于长期流入趋势中,而本轮外资波动后有所回流,但持续趋势尚未完全形成。
因此,我们认为本轮存款搬家趋势从动能和风险偏好角度可能低于 2017 年和 2021 年,股市流动性的改善和风险偏好的提升更加依赖宏观环境和房地产市场的进一步回暖。
存款搬家:“叙事” 与现实的启示
综上所述,我们认为存款搬家的市场 “叙事” 与现实之间仍存在一定分歧,根本上这一 “叙事” 源自 2023-2025 年居民从理财向存款的储蓄结构调整,并不意味着风险偏好的必然提高。67 万亿元中长期定期存款到期存在重新配置需求,但从历史经验看 90% 以上的存款仍然留存于银行系统。从分流的方向来看,私募基金和保险对于风险偏好较高、流动性需求较低的高净值投资者存在吸引力,但普遍的大规模存款入市迹象尚不明显。总之,相比 67 万亿元 “天量” 存款到期的 “叙事”,我们认为 6 万亿元 “超额储蓄” 的去向更为关键,居民风险偏好的提高、超额储蓄的释放取决于宏观和流动性环境的进一步改善。
对银行而言,存款搬家转为非银存款,负债转换形式但并未流失,非银存款成本略低于一般存款,但流动性指标有所承压。低利率时代,银行负债成本降低但波动性加大,对银行流动性管理形成了更高要求。
风险提示及免责条款
市场有风险,投资需谨慎。本文不构成个人投资建议,也未考虑到个别用户特殊的投资目标、财务状况或需要。用户应考虑本文中的任何意见、观点或结论是否符合其特定状况。据此投资,责任自负。
