
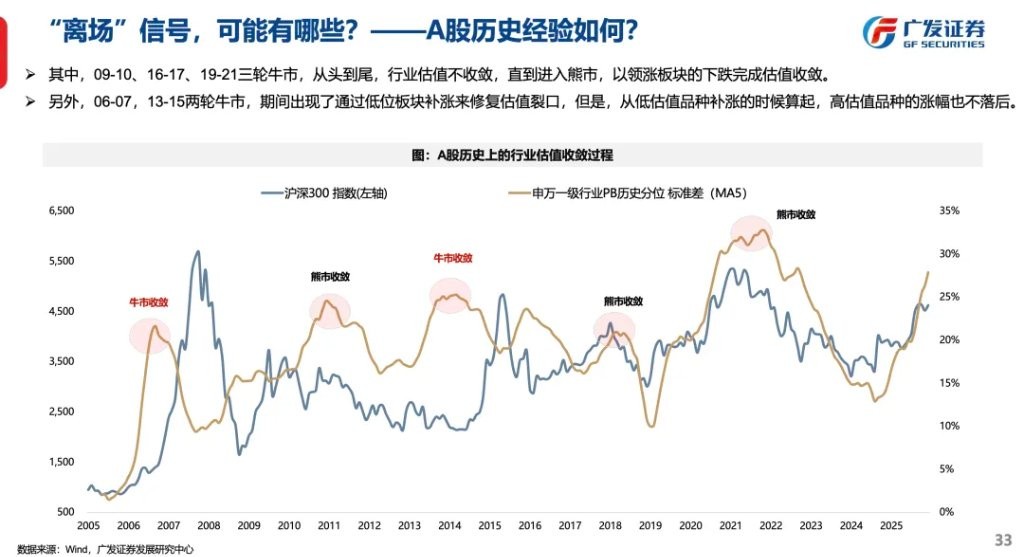
26-Year Pricing Logic Outlook: The "Spring" Has Not Yet Reached Its Limit

Analysis of the Global Bull Market Structure in 2025: The upward structure shows a "80/20 differentiation," with only 18% of A-shares experiencing a decline; the leading sectors are technology and resource products, benefiting from the AI industry cycle and de-dollarization; market capitalization concentration is increasing, with major global markets concentrated between 30%-50%, while China's concentration is only 18%. High-growth assets are scarce, with 36% of A-shares having a growth rate greater than 20%, while the proportion for U.S. stocks with a growth rate greater than 30% is 32%. Globalization is the source of growth, with A-share overseas revenue accounting for less than that of developed countries
Three Characteristics to Watch for the Global Bull Market Structure in 2025:
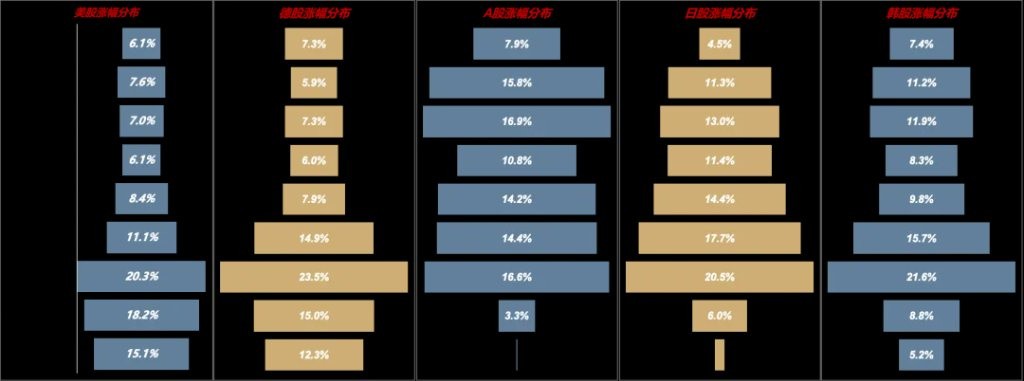
(1) Upward Structure: "The 80/20 Split." In the stock markets of the United States, Germany, Japan, and South Korea, the proportion of declining stocks in 2025 is 56%, 51%, 29%, and 35% respectively; the A-share market shows a certain characteristic of broad-based gains, with a decline ratio of only 18%.
(2) Leading Sectors: Technology and Resource Products, corresponding to two macro narratives: one is the AI industry cycle, and the other is the de-dollarization cycle. The leading sectors mostly have strong profit support.
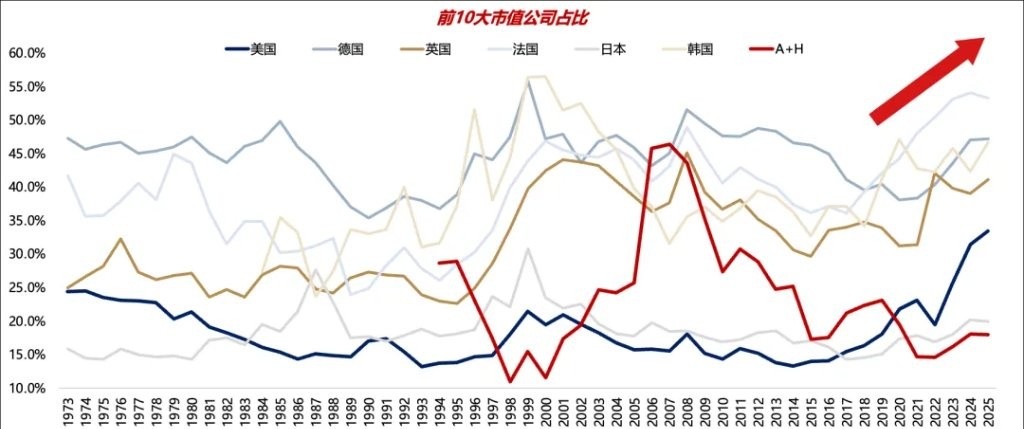
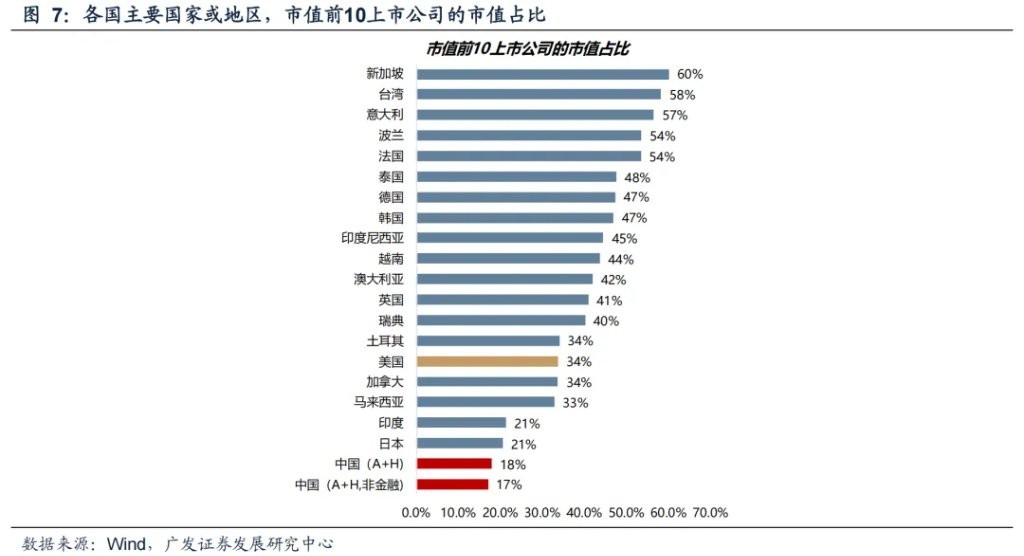
(3) Market Capitalization Concentration: Heading to New Highs. In major global equity markets, the concentration of market capitalization (top 10 proportion) is mostly between 30%-50%, and has been continuously rising in recent years; the market capitalization concentration of listed companies in China (including A-shares + Hong Kong stocks of Chinese companies) is currently only 18%; the concentration in the non-financial sector is even lower, at only 17%.
What Assets Will Lead Globally in 2025? — The Scarcity of High Growth
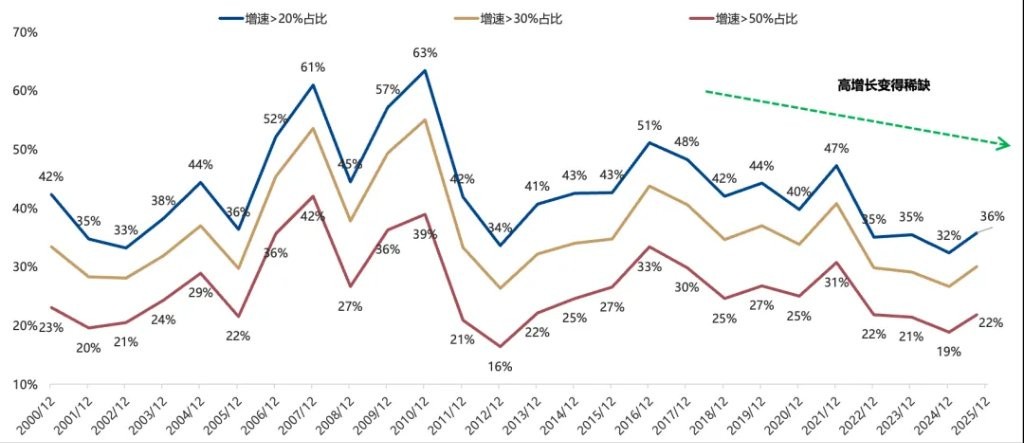
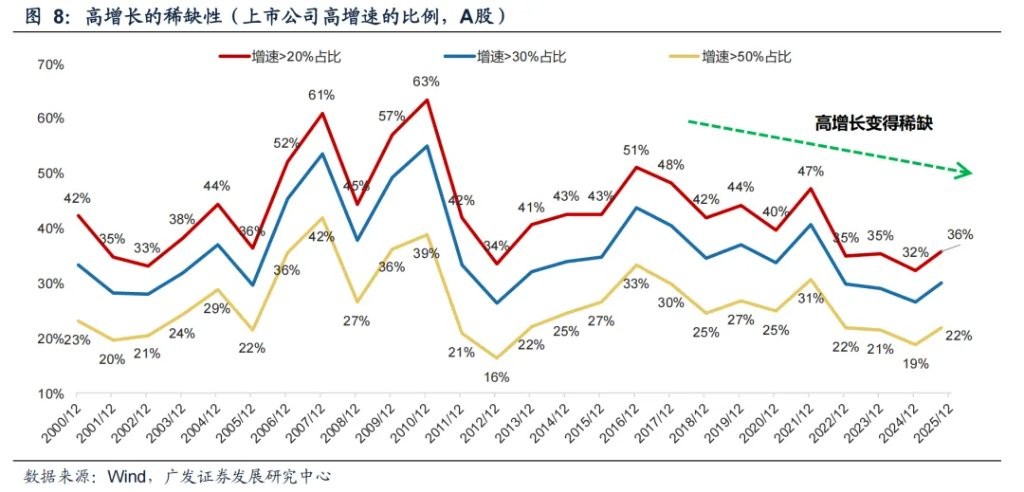
(1) After the flattening of the economic cycle, high-growth assets are becoming increasingly scarce. Companies in the A-share market with growth rates >20% account for 36%, compared to an average of about 45% in previous years.
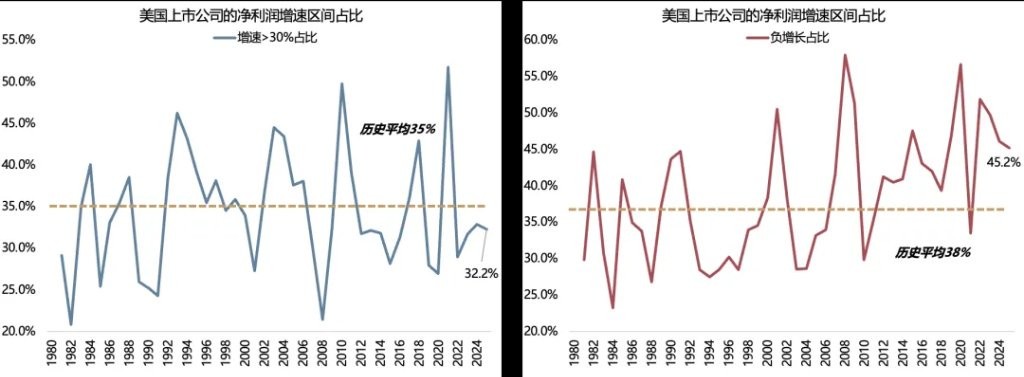
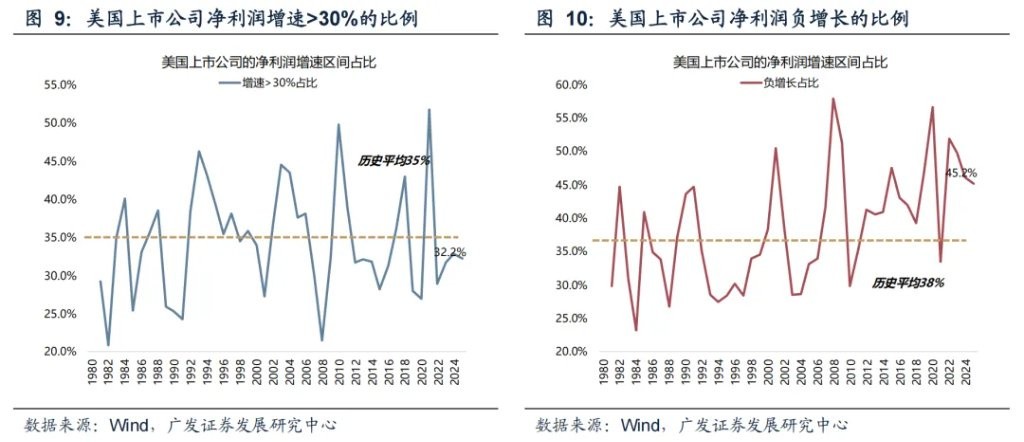
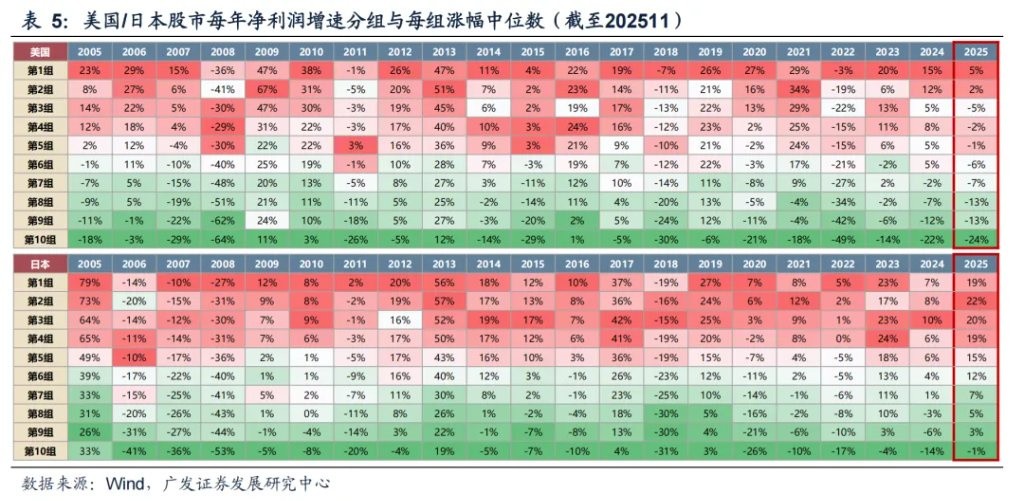
(2) High-growth assets overseas are also scarce. The proportion of U.S. stocks with growth rates >30% is 32%, below the historical average of 35%; at the same time, the proportion of negative growth is 45%, higher than the historical average of 38%.
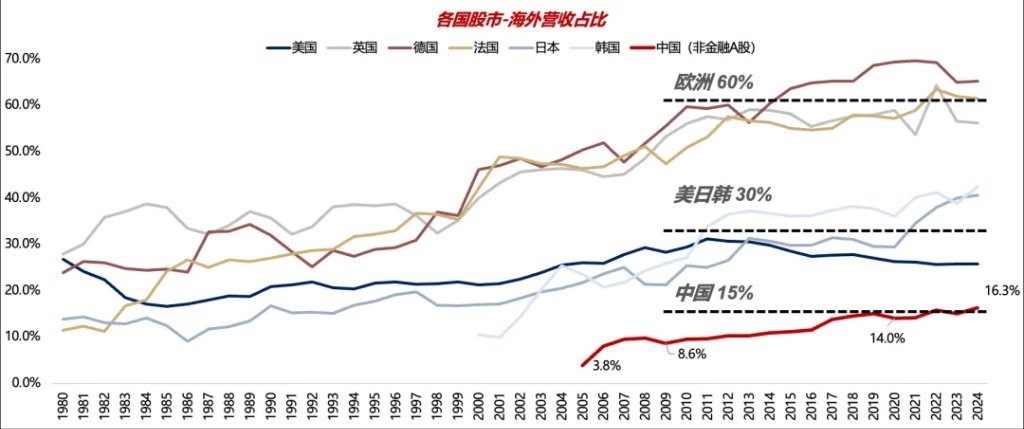
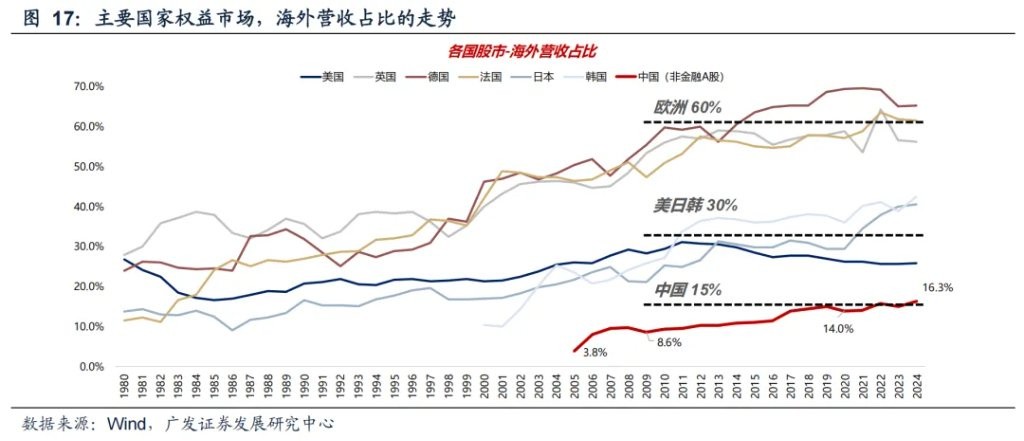
(3) Globalization is a source of sustained growth. High growth from globalization is mainly concentrated in the late 1980s to 2010, and in non-U.S. countries after 2020. From 1986 to 2010, the annualized revenue growth rates of listed companies in the U.S./Japan/Germany/UK/France were +7.6%/+2.0%/+5.4%/+7.8%/+7.5%, with overseas revenue growth rates of +9.2%/+4.0%/+6.4%/+8.7%/+9.1% (4) The proportion of overseas revenue for A-shares has continued to rise over the past 20 years, but it remains low compared to major developed countries. The overseas revenue proportion can be divided into three tiers: first is Europe (a major country for external demand/going abroad), with a central overseas revenue proportion of 60%; second is the US and Japan (with strong support from domestic demand), with a central proportion of 30%; third is China (a major country for both domestic and external demand), with a central proportion of 15%.
Is the "rope" of fundamentals still effective? — More extreme pricing of prosperity
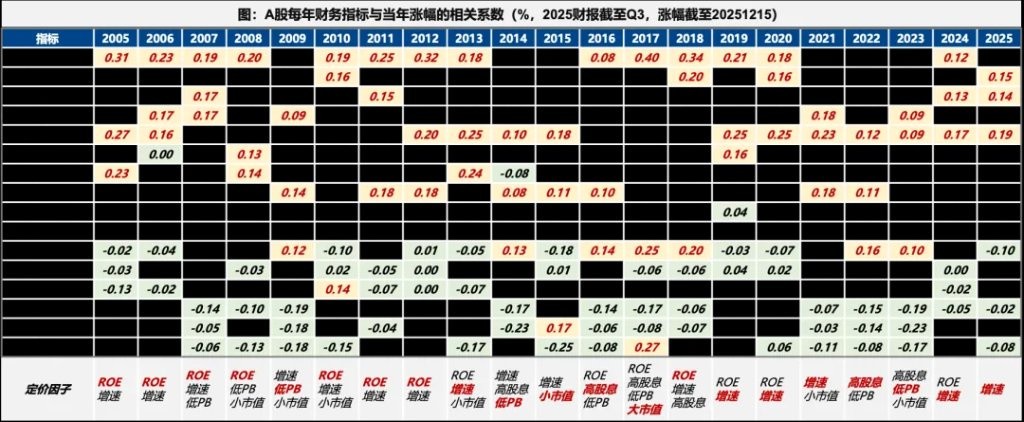
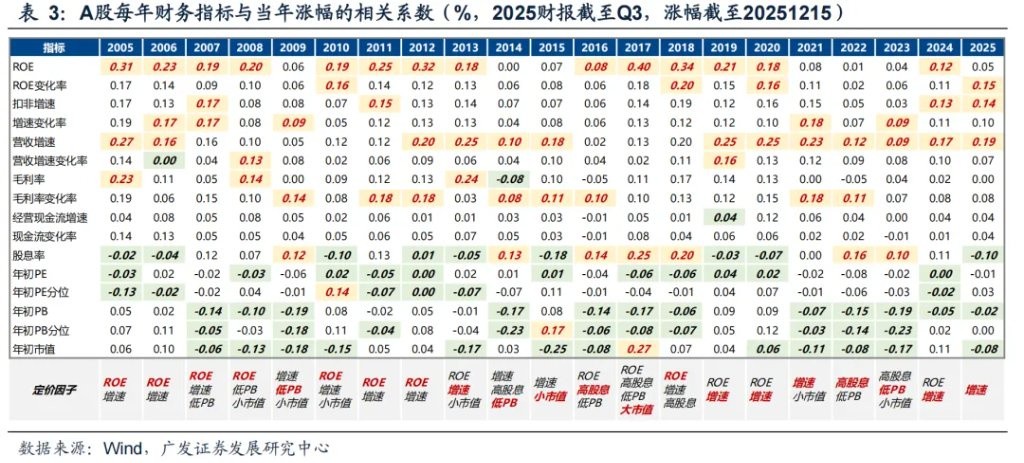
In 2025, the pricing of prosperity for A-shares will be more extreme and exclusive. (1) In previous years, the most effective financial indicators overall were: ROE, net profit/revenue growth rate, PB, and dividend yield; (2) Various pricing factors will show significant rotation, but each year, there are usually two or more prominent styles; (3) However, in 2025, the effectiveness of prosperity factors will be significantly stronger than other financial factors.
Four, will 2026 move towards extremity or convergence — not yet extreme, and after extremity, there may also be "bull market convergence."
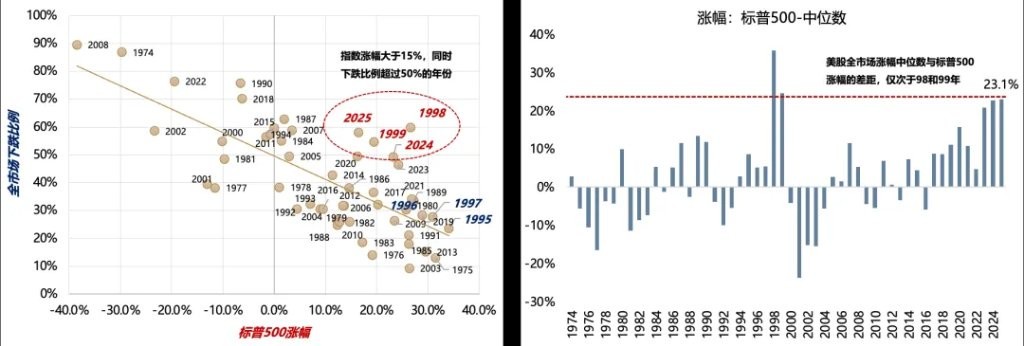
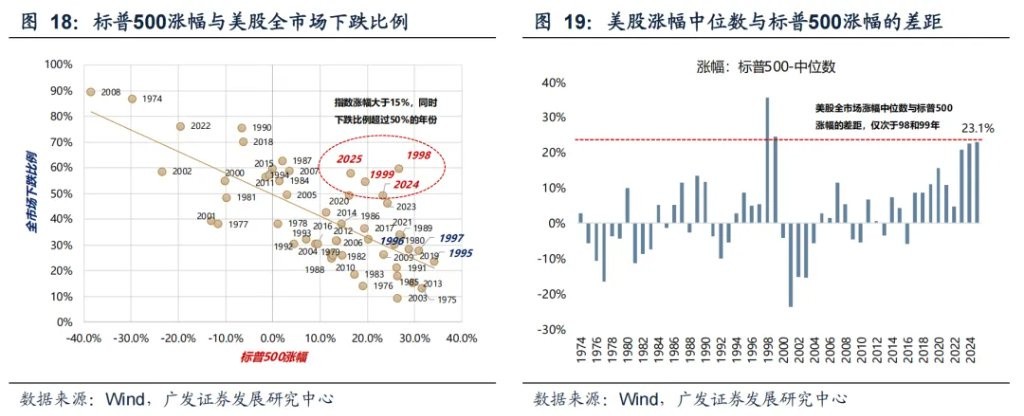
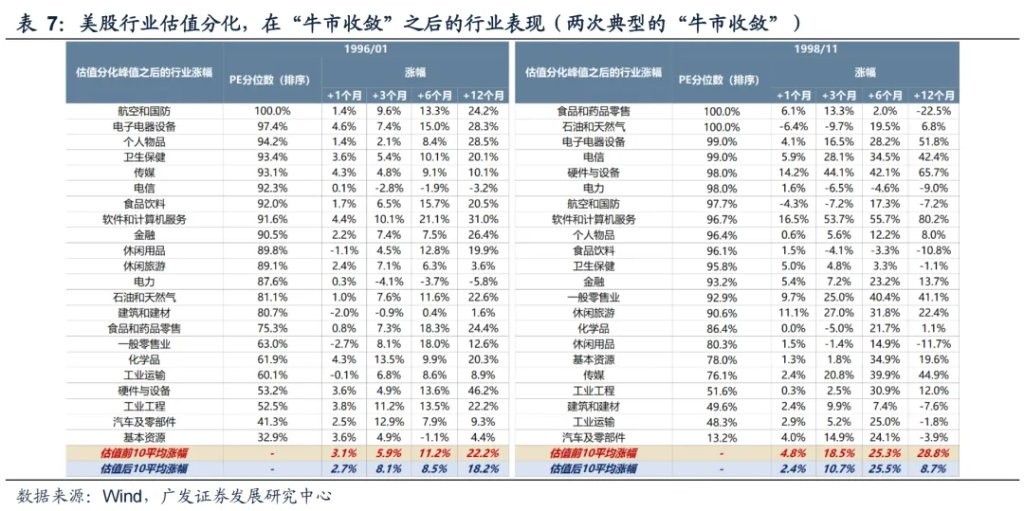
(1) Is the current market pricing a "golden-haired girl"? It seems ambiguous; the current structure of US stock fluctuations is very extreme — a significant rise in the index + more than half of the stocks falling, resembling the latter half of the "golden-haired girl" period in 1998-1999.
(2) What might be the "exit" signals? ① The degree of dispersion in industry gains, ② the degree of valuation dispersion, ③ market capitalization proportion, ④ transaction volume proportion, none of which are effective "exit" signals. Among them, after the extreme differentiation of valuations in the US stock market, there have only been two typical bear market convergences (the end of interest rate hikes in 1881/recession; the end of interest rate hikes in 2000/recession), while the other 12 times were all bull market convergences. In a bull market, valuation convergence often sees high-valuation sectors performing well and not lagging behind low-valuation sectors in catch-up.


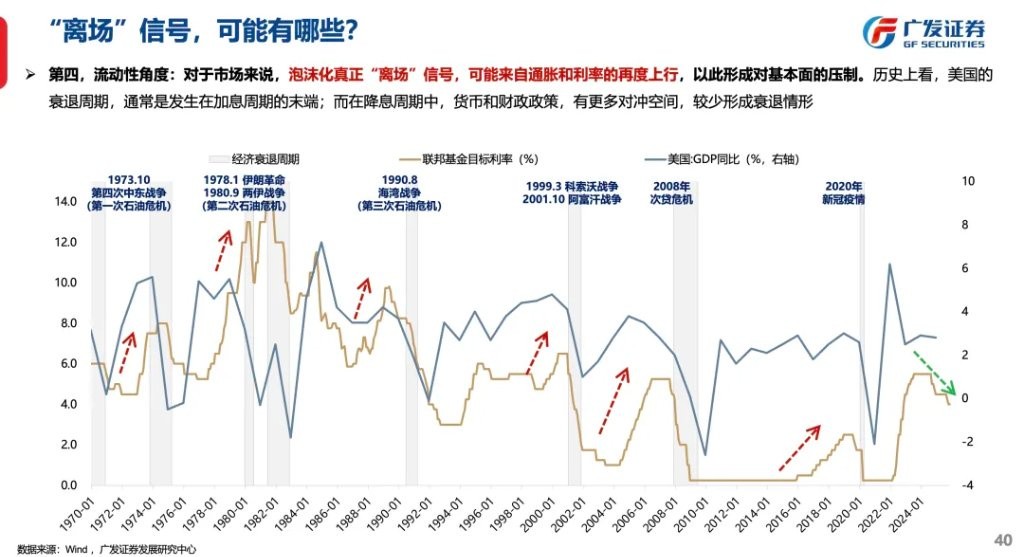
(3) The true "exit" signal of the bubble may come from the renewed rise in inflation and interest rates, which would suppress future fundamentals. During a rate-cutting cycle, especially with the mid-term elections, monetary and fiscal policies have more hedging space, resulting in fewer recession scenarios.
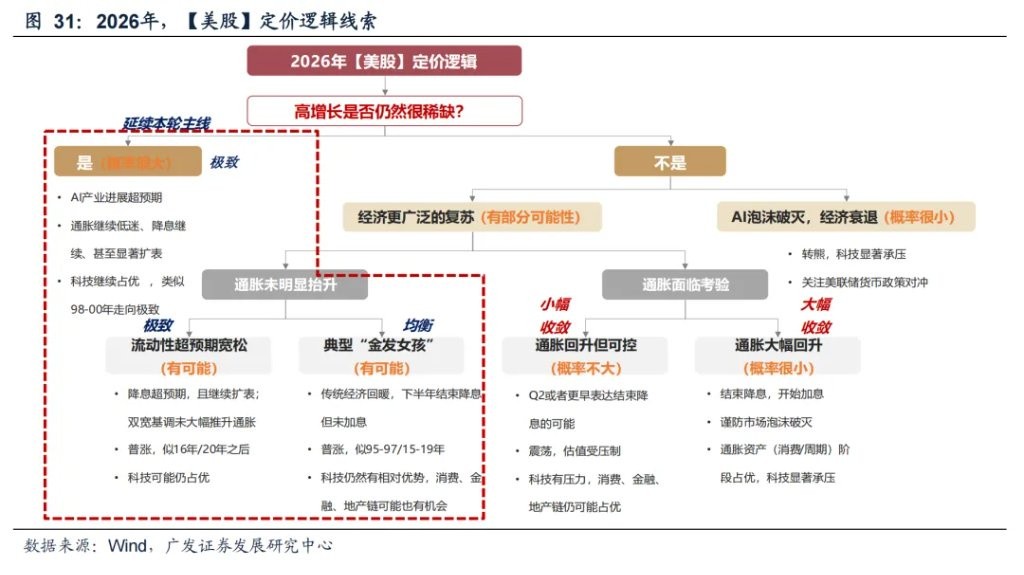
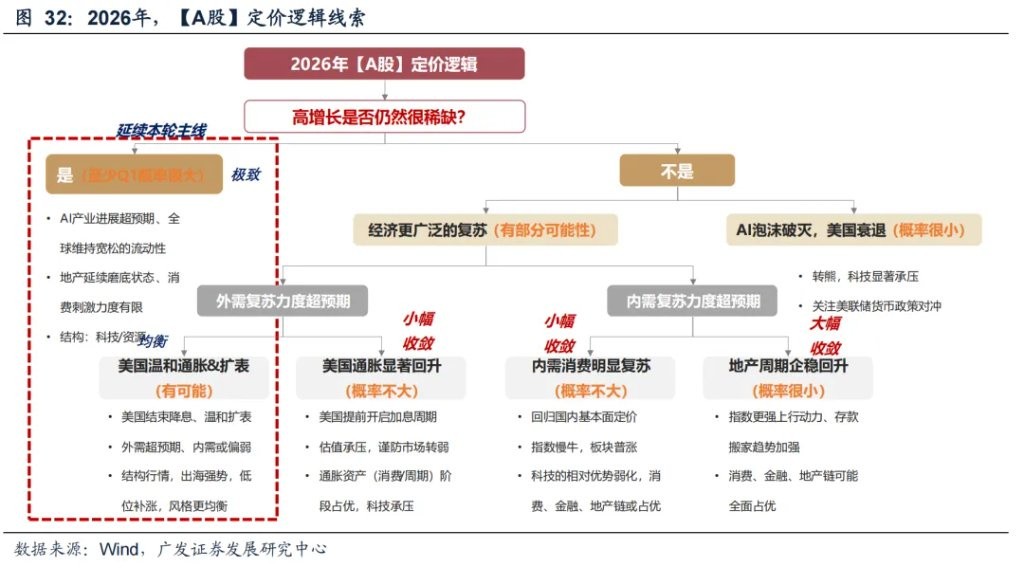
(4) Pricing logic clues for 2026: Can the scarce high growth be sustained (if sustained, it leads to extremity) -> Is there a broader recovery (if yes, then relatively balanced) -> Is U.S. inflation controllable under recovery (if yes, then leads to balance) -> Is there a significant recovery in China's domestic demand (if yes, then leads to convergence).

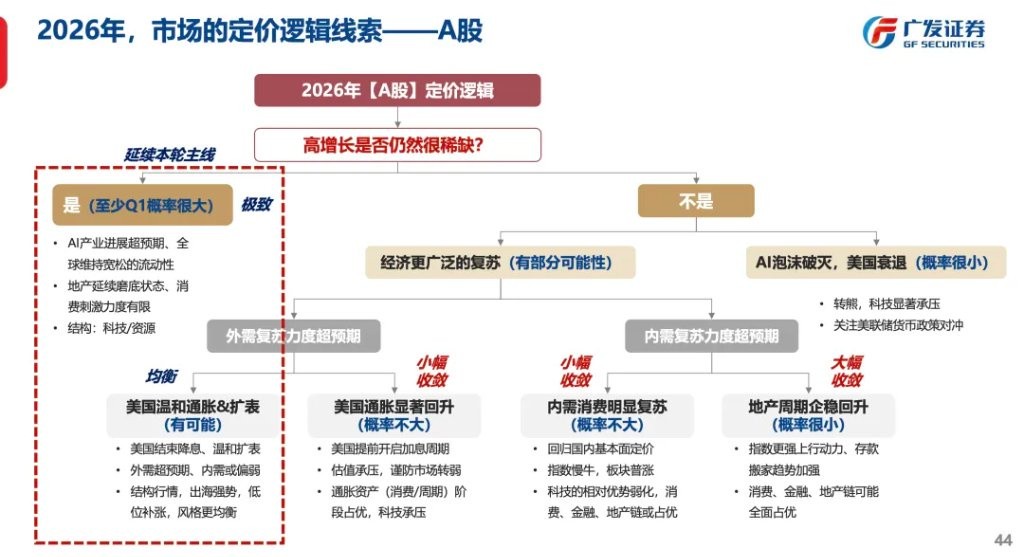
(Note: The two red dashed boxes in the above image represent the pricing logic chains that we believe have a higher probability, while other logic chains are mainly for response.)
Report Body
Three Characteristics: Observing the Global Bull Market Structure
This year, the global equity market has shown significant structural characteristics. We analyze it from three perspectives.
(1) Rising Structure: "Two-Eight Divergence"
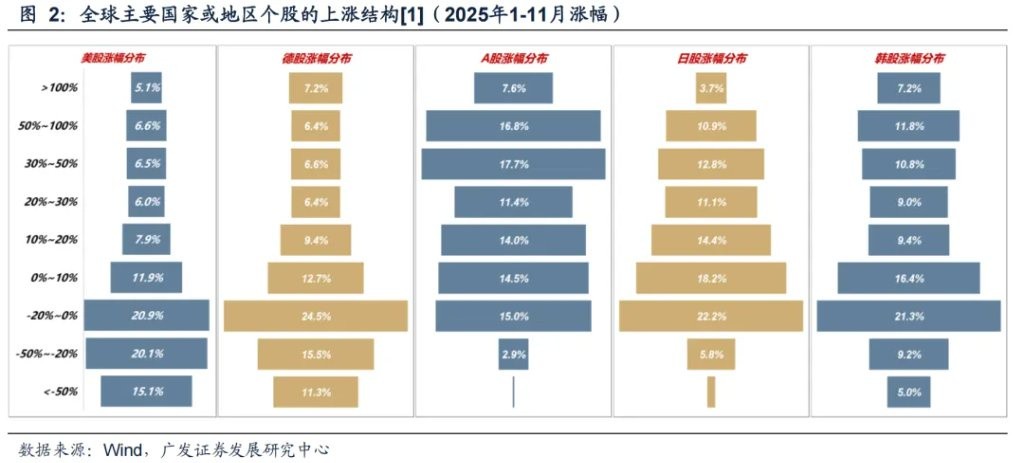
The rising structure of the global stock market shows a "two-eight divergence."
As of November 2025, the proportion of declining stocks in the U.S., Germany, Japan, and South Korea is 56%, 51%, 29%, and 35%, respectively; in contrast, the A-share market shows a certain characteristic of broad-based gains, with a decline ratio of only 18%.
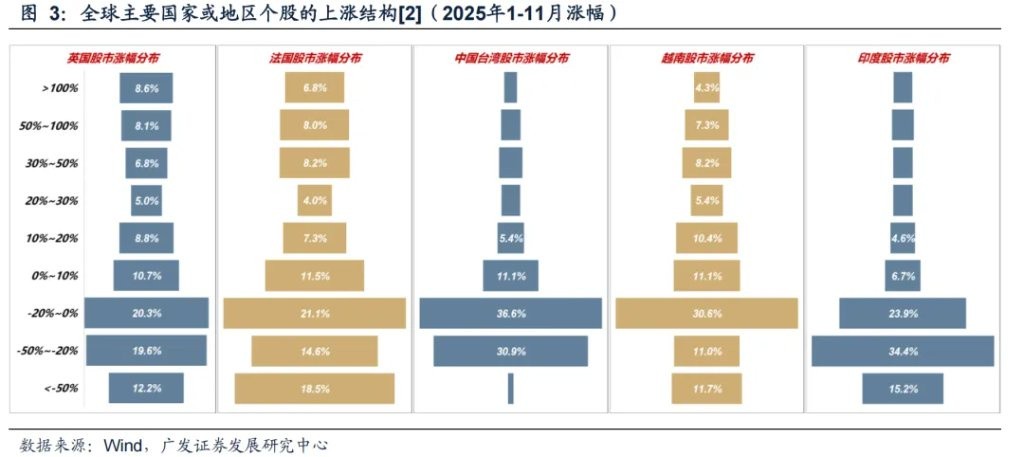
In some countries or regions, the degree of divergence is even more severe. For example, in Taiwan, China, the proportion of declines this year reached 69%; in Vietnam and India, the proportions of declines this year reached 53% and 74%, respectively.
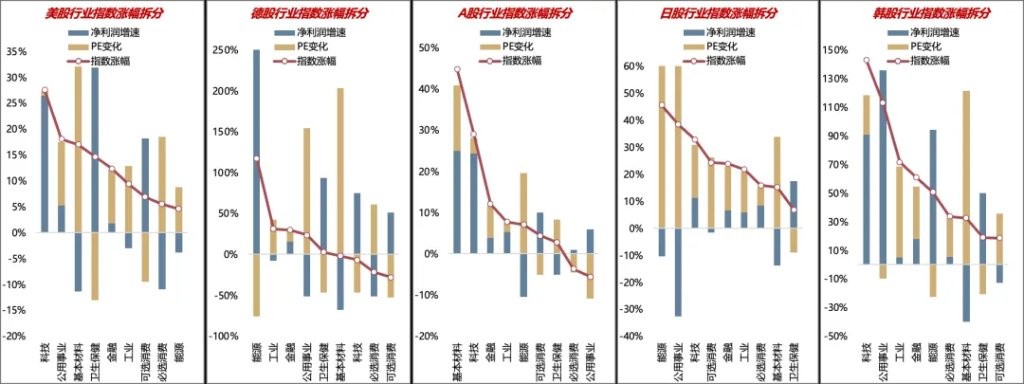
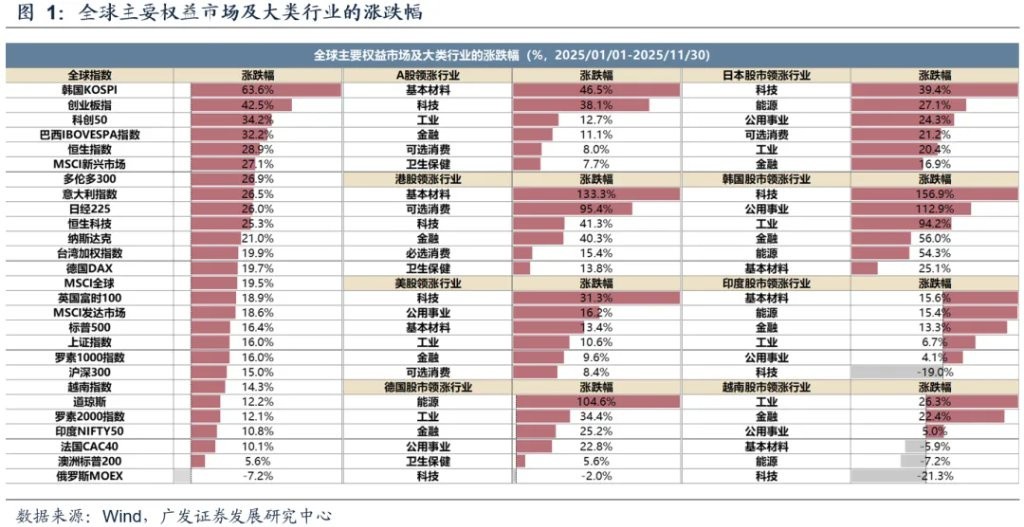
(2) Leading Sectors: Different Paths, Same Goal
The leading sectors mainly fall into two categories: one is the technology sector, and the other is resources and energy. Behind this are two macro narratives of pricing: one is the accelerated AI industry cycle and booming investment, and the other is the de-dollarization cycle and the repricing of resource products.
Additionally, behind the global bull market, valuation has contributed a significant portion, but most leading sectors have strong profit support. For example, from January to November 2025, the leading technology sector in the U.S. rose by 26.7%, with profit growth of 26.4% and a valuation contribution of 0.9%; the leading technology sector in South Korea rose by 143.0%, with profit growth of 90.9% and a valuation contribution of 27.3%.

 (3) Market Capitalization Concentration: Moving Towards New Heights
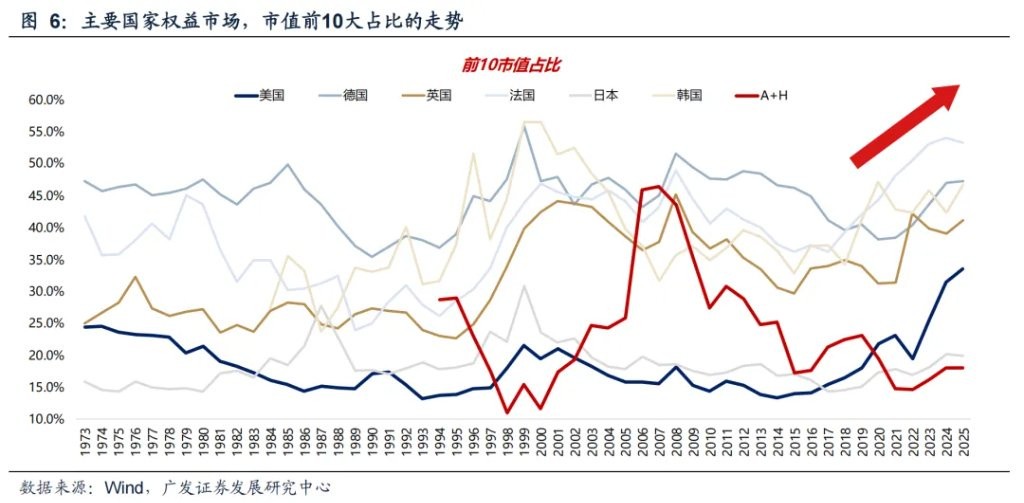
From a trend perspective, since 2020, the weight of market capitalization in the equity markets of most countries has continued to rise, currently reaching new highs or approaching historical peaks. In contrast, the market capitalization concentration of A-shares has been trending downward in recent years, with its previous high occurring in 2007-2008, when the heavyweight stocks included PetroChina, ICBC, CCB, China Life, and Shenhua.
In major global equity markets, the market capitalization concentration (the proportion of the top 10 local listed companies by market capitalization) is mostly between 30%-50%. Countries or regions with an outward-oriented economy tend to have higher market capitalization concentration. For example, the top 10 in Singapore accounts for 60%, Taiwan's top 10 accounts for 58%, and the top 10 in countries like Italy, France, and Poland also exceeds 50%.
Surprisingly, the proportion of the top 10 largest market capitalization companies in the United States is only 34%, ranking relatively low. Although U.S. tech companies have led the market in recent years, the market capitalization concentration of U.S. listed companies is not high in a global comparison.
Additionally, the market capitalization concentration in developing countries is relatively low, such as 44% in Vietnam, 33% in Malaysia, and 21% in India. Meanwhile, the market capitalization concentration of Chinese companies (including A-shares + Hong Kong-listed Chinese stocks) is the lowest, currently at only 18%; the concentration in the non-financial sector is even lower, at just 17%.
What Are the Leading Global Assets Trading—The Scarcity of High Growth
After the flattening of the economic cycle, high-growth assets are becoming increasingly scarce. In the A-share market, companies with a net profit growth rate greater than 20% account for 36%, with the central tendency over the past 10 years being around 42% and about 45% over the past 20 years. In this context, the rise in "the 20% of stocks" and the increase in market capitalization concentration have their inherent rationality.
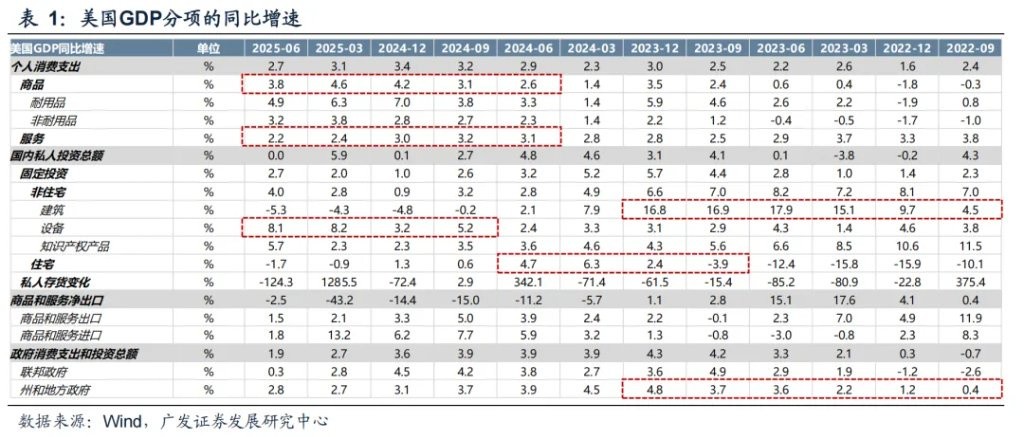
The economic cycle in the United States is also flattening. Since the pandemic, the fundamentals of the U.S. economy have shown strong resilience, with no significant downturn and no strong recovery during the upturn; in other words, the economic cycle is also flattening. Since the second half of 2022, the supporting factors of the U.S. economy have experienced: government spending (second half of 2022 - 2023) -> construction investment (second half of 2022 - 2023) -> consumer goods (since early 2023) -> residential investment (second half of 2023 - first half of 2024) -> service consumption/consumer goods, equipment investment (since 2024)
High-growth overseas assets are also scarce.
Although the bull market in U.S. stocks has lasted for 3 years, companies with high earnings growth are still scarce. Currently (as of 202511), the proportion of U.S. listed companies with a net profit growth rate >30% is 32%, lower than the historical average of 35%; at the same time, the proportion of companies with negative growth is 45%, higher than the historical average of 38%.
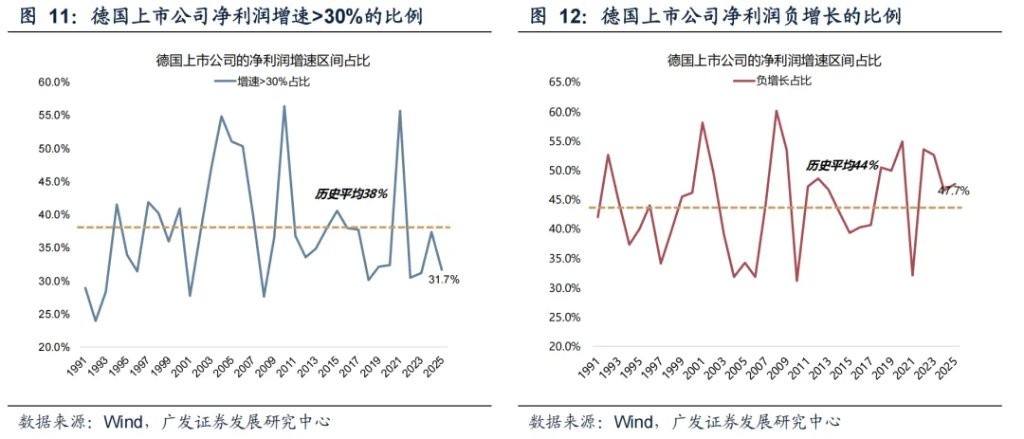
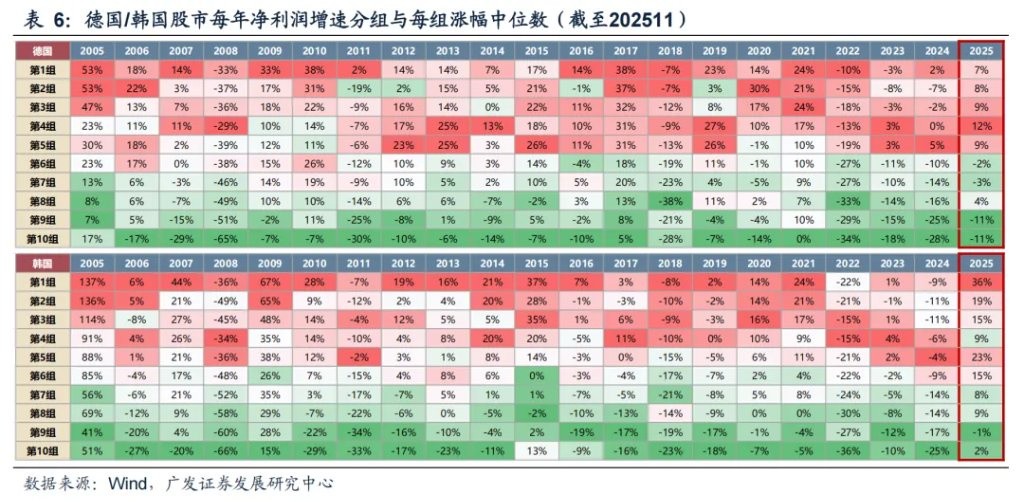
Germany's profit structure is also weak. Currently (as of 202511), the proportion of German listed companies with a net profit growth rate >30% is 31.7%, and the proportion of negative growth reaches 47.7%, both weaker than the historical average, especially since the overall profit situation in 2025 has not improved compared to the previous year.
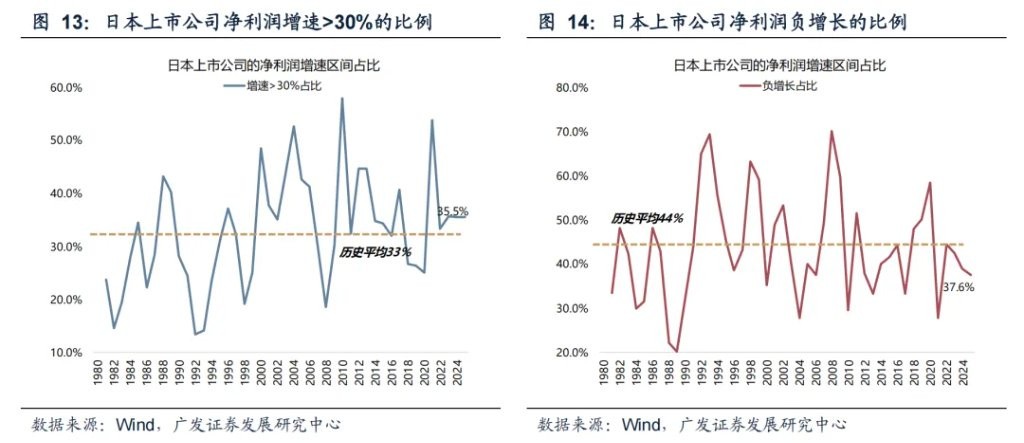
Japan's profit structure is relatively better. Currently (as of 202511), the proportion of Japanese listed companies with a net profit growth rate >30% is 35.5%, and the proportion of negative growth reaches 37.6%, both slightly better than the historical average.
Globalization is a source of sustained growth.
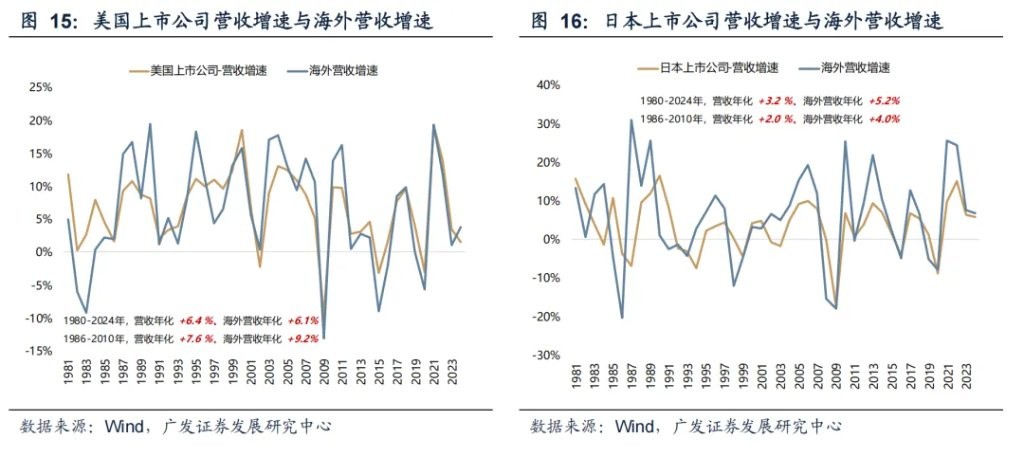
High growth from globalization mainly concentrated from the late 1980s to 2010, with another period being after 2020 in non-U.S. countries. From 1986 to 2010, the annualized revenue growth rates for listed companies in the U.S./Japan/Germany/UK/France were +7.6%/+2.0%/+5.4%/+7.8%/+7.5%, while the annualized growth rates for overseas revenue were +9.2%/+4.0%/+6.4%/+8.7%/+9.1%.
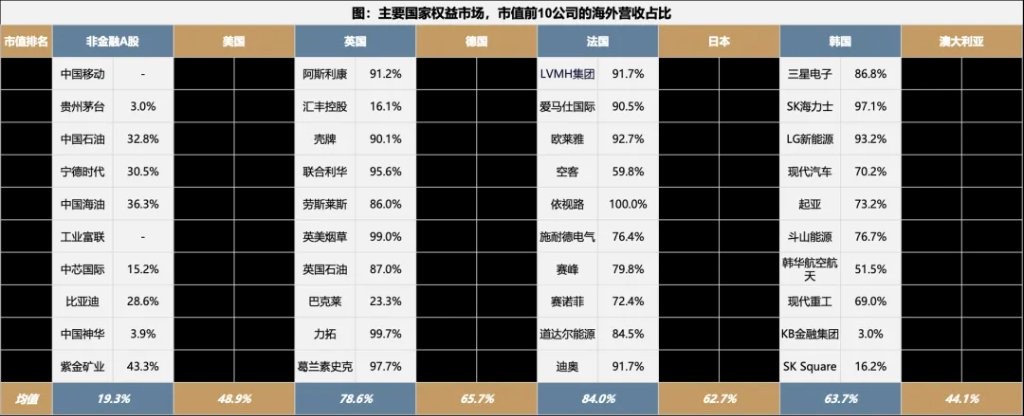
In major countries' equity markets, the top 10 non-financial companies by market capitalization are mostly highly globalized, with overseas revenue accounting for 60% or even over 90%, concentrated in technology, manufacturing, resources, and discretionary sectors, while financial and staple sectors usually have lower proportions. In contrast, the current overseas revenue proportion of large-cap non-financial A-shares is still relatively low, which is also one of the important reasons for the low market capitalization concentration in A-shares
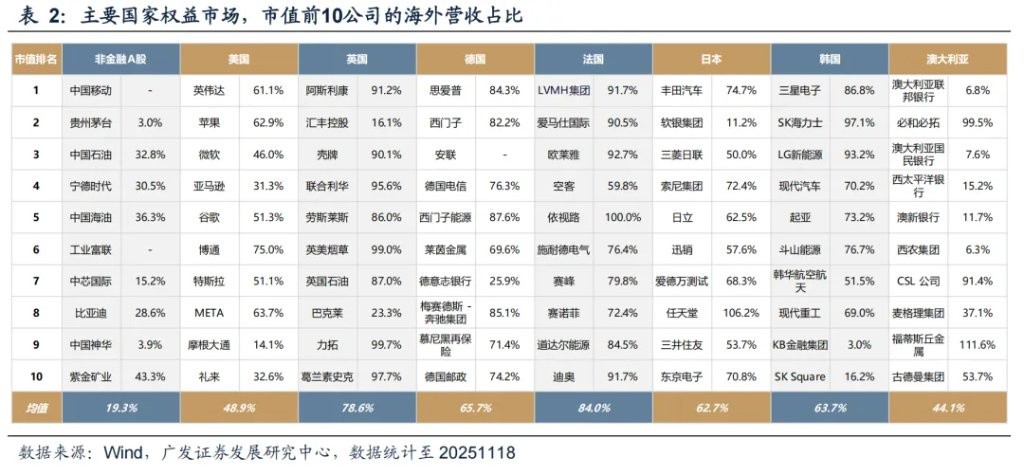
The proportion of overseas income for A-shares has continued to rise over the past 20 years, but it remains low compared to major developed countries. In the equity markets of major countries, the proportion of overseas revenue can be divided into three tiers:
First, Europe (a major country for external demand/going abroad), with an overseas revenue proportion centered around 60%;
Second, the United States and Japan (with strong support from domestic demand), centered around 30%;
Third, China (a major country for both domestic and external demand), centered around 15%.
Is the "rope" of fundamentals still useful—pricing based on prosperity becomes more extreme
In 2025, the pricing based on prosperity for A-shares will become more extreme and exclusive. (1) In previous years, overall, the most effective financial indicators were: ROE, net profit/revenue growth rate, PB, and dividend yield; (2) Various pricing factors will show obvious rotation, but each year, there are usually two or more prominent styles; (3) However, in 2025, the effectiveness of the prosperity factor (growth rate) will be significantly stronger than other financial factors.
In 2025, the pricing based on prosperity for A-shares will become more extreme. The pricing logic behind this lies in the previously mentioned "scarcity of high growth," the scarcer and more extreme, the better.

This year, the pricing based on prosperity in overseas markets is also very prominent. Market hotspots are concentrated in technology and resources, which are also directions of high profit growth.
Moving towards extremity or convergence—"the spring may not have reached its limit"
(1) Is the current market pricing a "golden-haired girl"?
Is the current market pricing a "golden-haired girl"? It seems ambiguous.
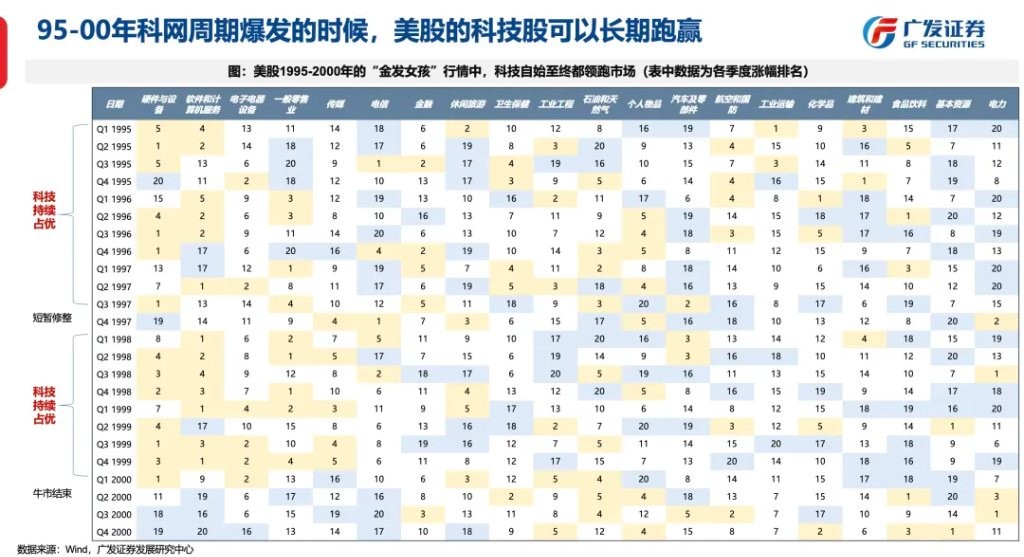
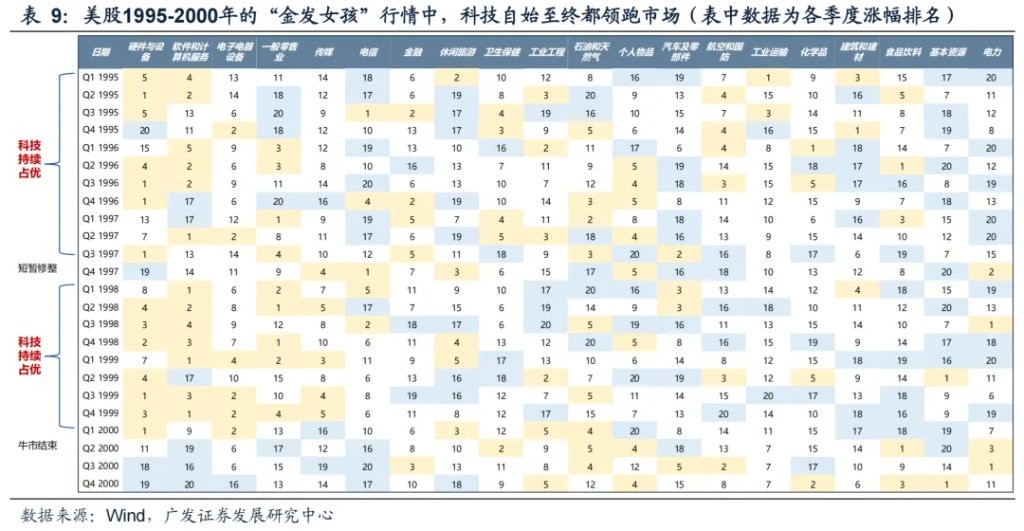
(1) The "golden-haired girl" economy in the United States, most typically from 1995 to 2000, was driven by the information technology revolution, presenting a perfect combination of high growth, low inflation, low unemployment, and moderate interest rates, with the stock market experiencing a general rise in the first half and acceleration in the second half In addition, there are two commonly mentioned phases:
(2) From 2015 to 2019, after the financial crisis, the economy experienced moderate growth, stable inflation, and declining unemployment. The Federal Reserve gradually raised interest rates to the neutral range, which was seen as a mild version of the "Goldilocks" scenario, with a broad rise in the stock market;
(3) 2024-2025 (as of now): After the end of the interest rate hike cycle, inflation has receded, the economy has not entered a recession, and employment remains resilient. However, from the market performance perspective, the upward structure of this phase does not exhibit typical "Goldilocks" characteristics. The rise and fall structure of the stock market is extreme—indices soaring (with gains exceeding 15%) + over half of the market declining—coexisting, resembling more the latter part of "Goldilocks" in 1998-1999.
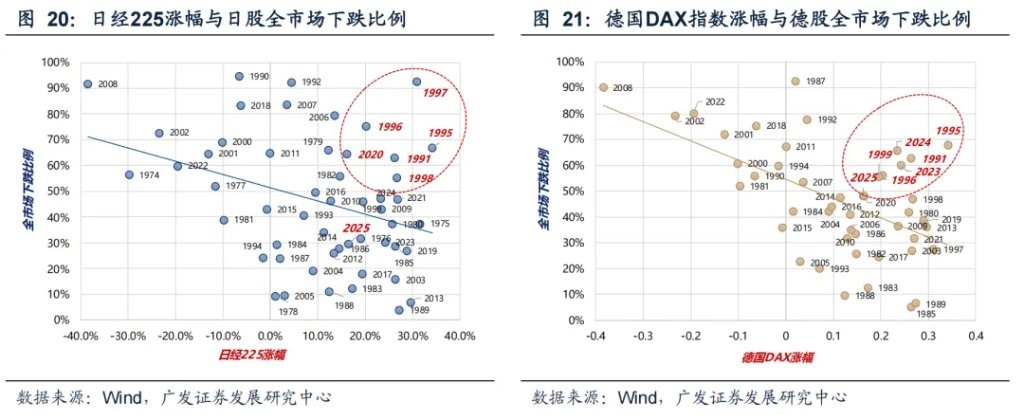
In other countries' stock markets, taking Japan and Germany as examples, the extreme upward structure (indices soaring + widespread individual stock declines) has primarily occurred during the periods of 1995-2000 and 2023-2025.
So, is this market structure heading towards extremity or convergence, or in other words, for the main structural sectors, when might there be signals for "exiting" or "switching"?
(2) What might be the "exiting" signals?
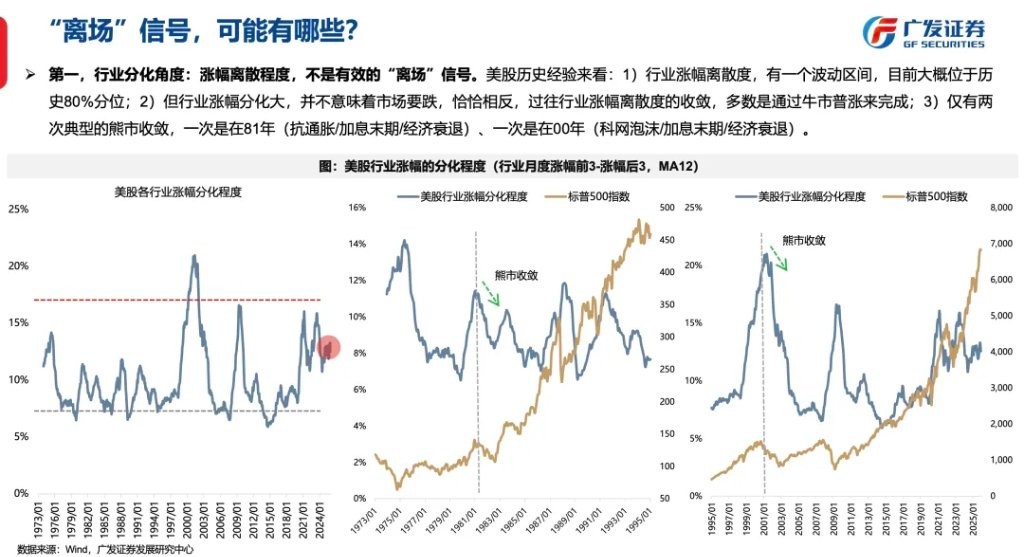
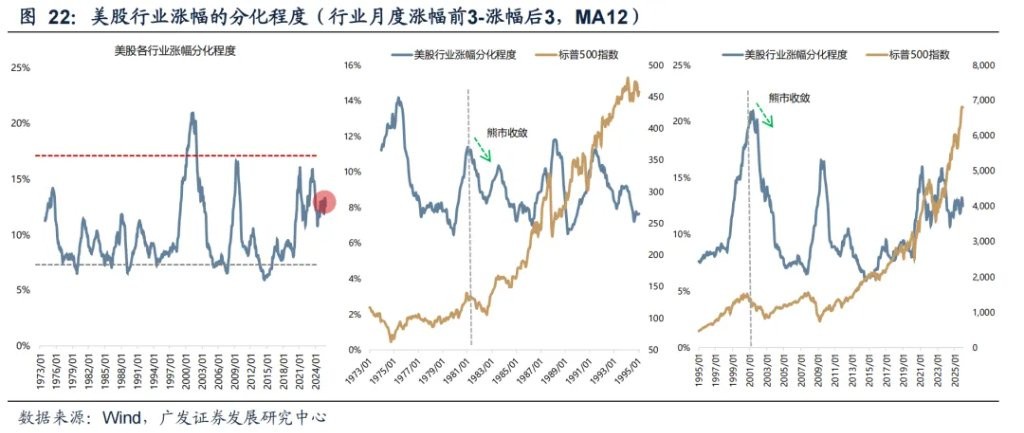
First, from the perspective of industry differentiation: the degree of dispersion in gains is not an effective "exiting" signal.
From the historical experience of the U.S. stock market:
(1) The dispersion of industry gains has a volatility range, currently approximately at the historical 80th percentile;
(2) However, significant differentiation in industry gains does not mean the market will decline; on the contrary, past instances of convergence in industry gain dispersion have mostly been completed through broad market rallies during bull markets;
(3) There have only been two typical bear market convergences, one in 1881 (anti-inflation/interest rate hike end/economic recession) and one in 2000 (dot-com bubble/interest rate hike end/economic recession).
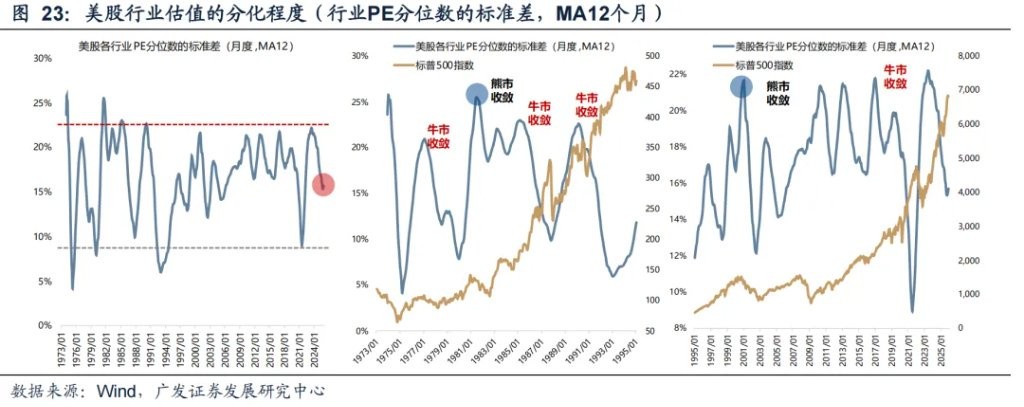
Second, from the perspective of industry valuation: the degree of dispersion in valuations is also not an effective "exiting" signal.
The differentiation and convergence of U.S. stock market industry valuations also exhibit some regular characteristics:
(1) Valuation differentiation and convergence have clearer operational ranges;
(2) The current PE dispersion is only at the historical 34th percentile, still far from extremes;
(3) In the past, after extreme valuation differentiation, there has always been convergence, but the manner of convergence can be through bull market convergence or bear market convergence; (4) Historically, there have only been two typical bear market contractions, one in 1981 and the other in 2000, while the remaining 12 instances were bull market contractions.
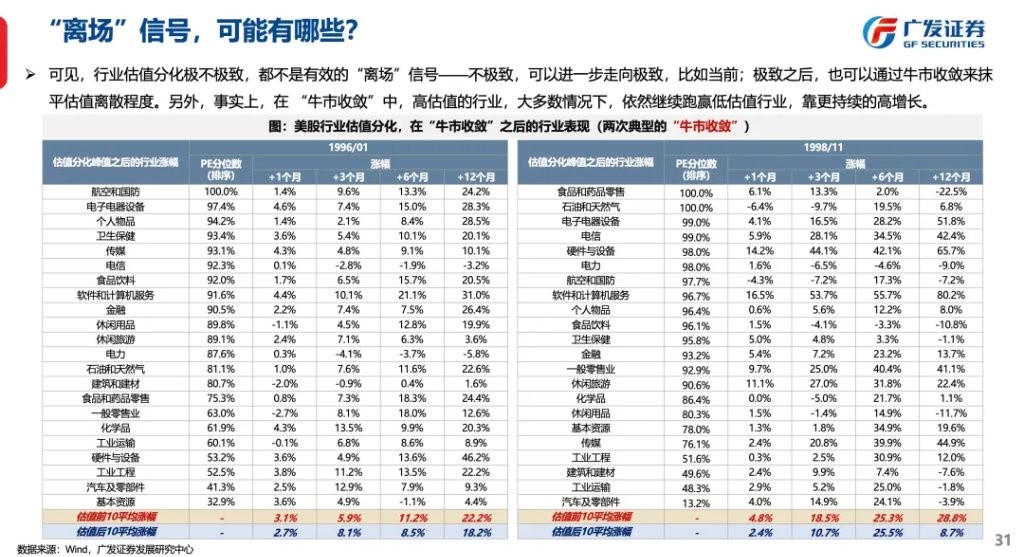
It can be seen that the differentiation in industry valuations is not extreme, and neither is it an effective "exit" signal—if it is not extreme, it can further move towards extremity, as is the case currently; after reaching extremity, it can also smooth out valuation dispersion through bull market contraction. Moreover, in fact, during "bull market contractions," high-valuation industries, in most cases, continue to outperform low-valuation industries due to more sustained high growth.
In contrast, during "bear market contractions," high-valuation industries will significantly underperform low-valuation industries because the high growth in profits has already been interrupted.
Therefore, the unsustainable profit trend in booming industries is the signal that triggers "contraction" or "exit."

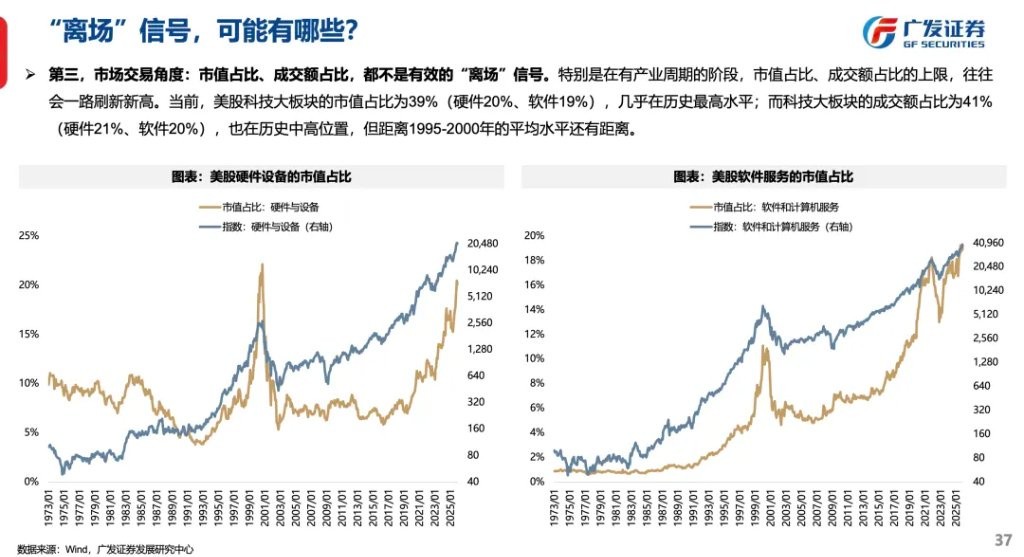
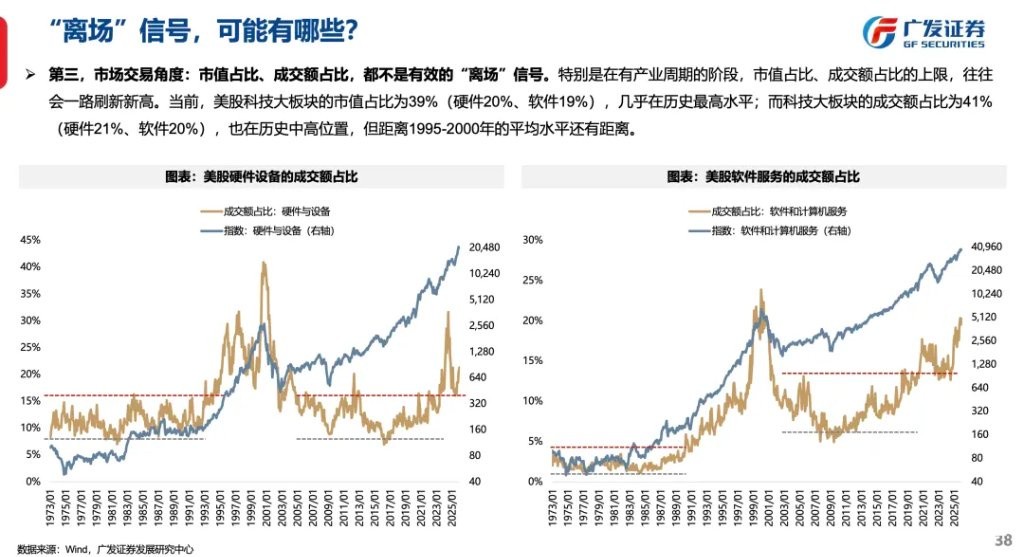
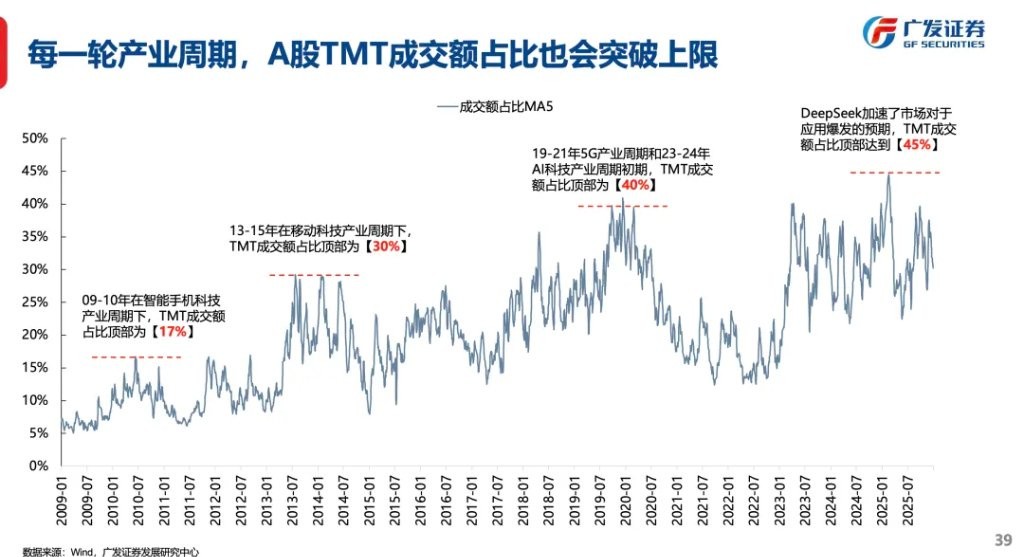
Third, from the market trading perspective: market capitalization ratio and trading volume ratio are not effective "exit" signals. Especially during phases with industrial cycles, the upper limits of market capitalization ratio and trading volume ratio often continuously refresh new highs.
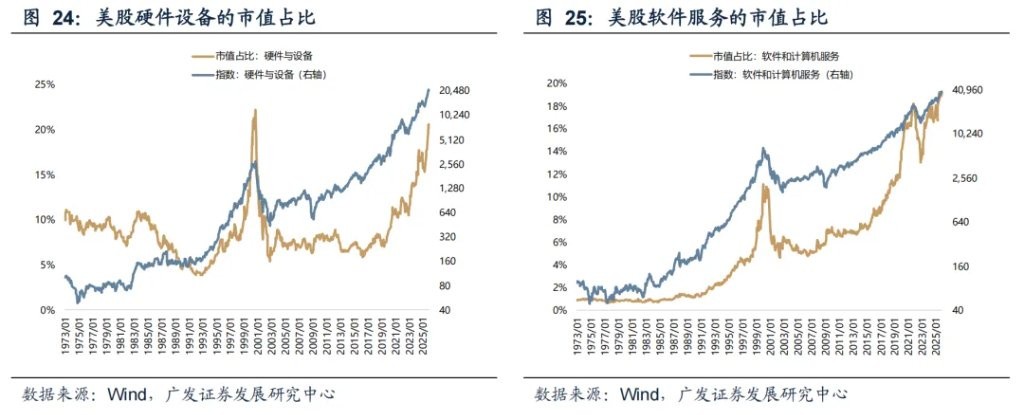
Currently, the market capitalization ratio of the U.S. tech sector is 39% (hardware 20%, software 19%), almost at historical highs;
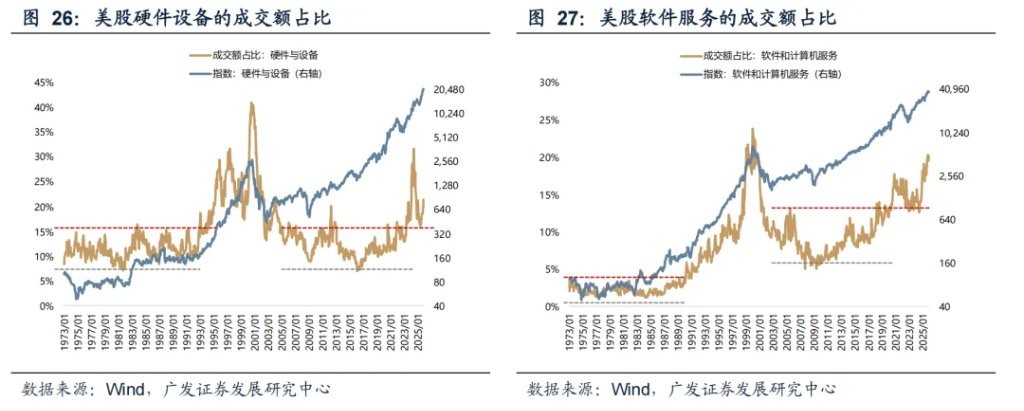
While the trading volume ratio of the tech sector is 41% (hardware 21%, software 20%), also at a historically high position, but still some distance from the average level of 1995-2000.
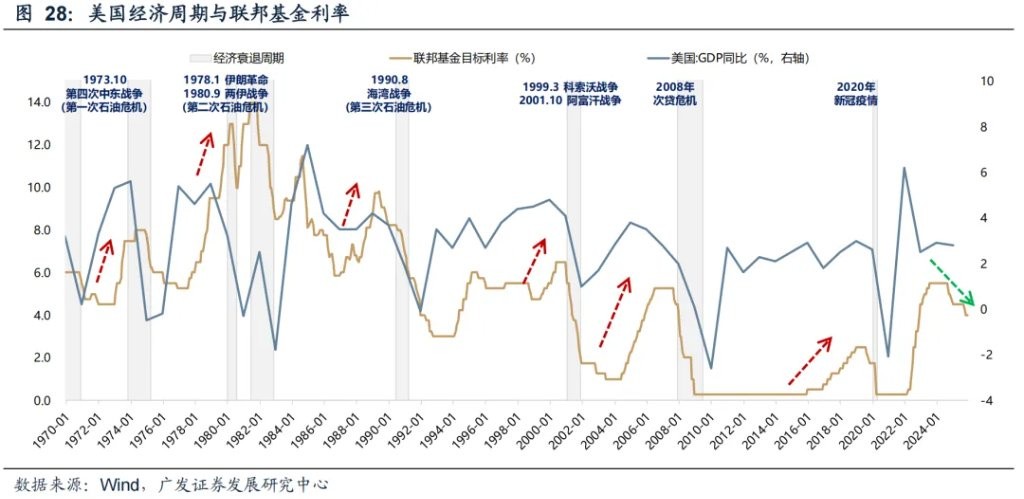
Fourth, from the liquidity perspective: for the market, the true "exit" signal of bubbling may come from the renewed rise in inflation and interest rates, thereby exerting pressure on the fundamentals.
Historically, the recession cycles in the U.S. usually occur at the end of the interest rate hike cycle; while during the interest rate cut cycle, monetary and fiscal policies have more hedging space, resulting in fewer recession scenarios
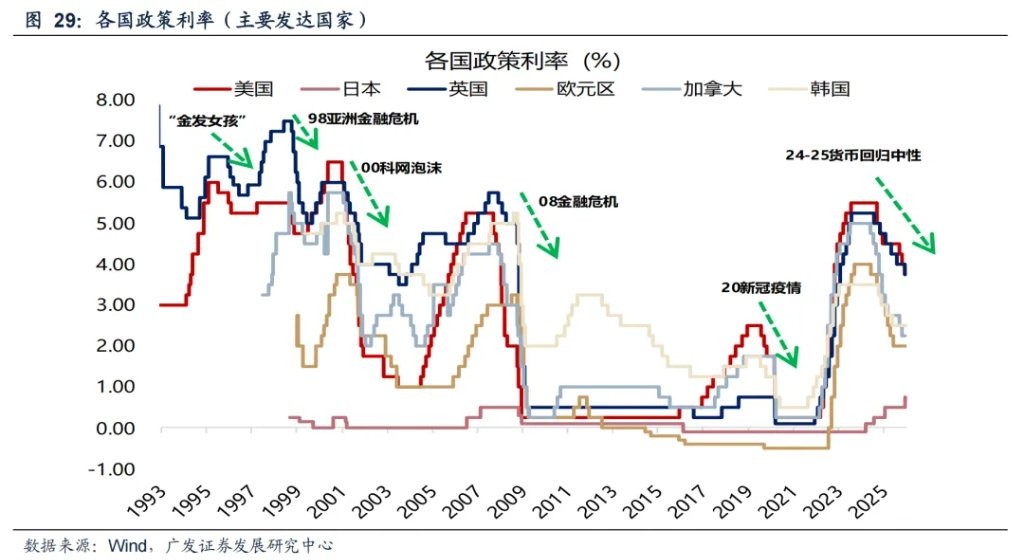
Since 2025, most central banks around the world have shifted to an accommodative stance. However, this shift is not due to the need for economic stimulus, but rather a gradual exit from the restrictive interest rate policies implemented to combat high inflation after the pandemic.
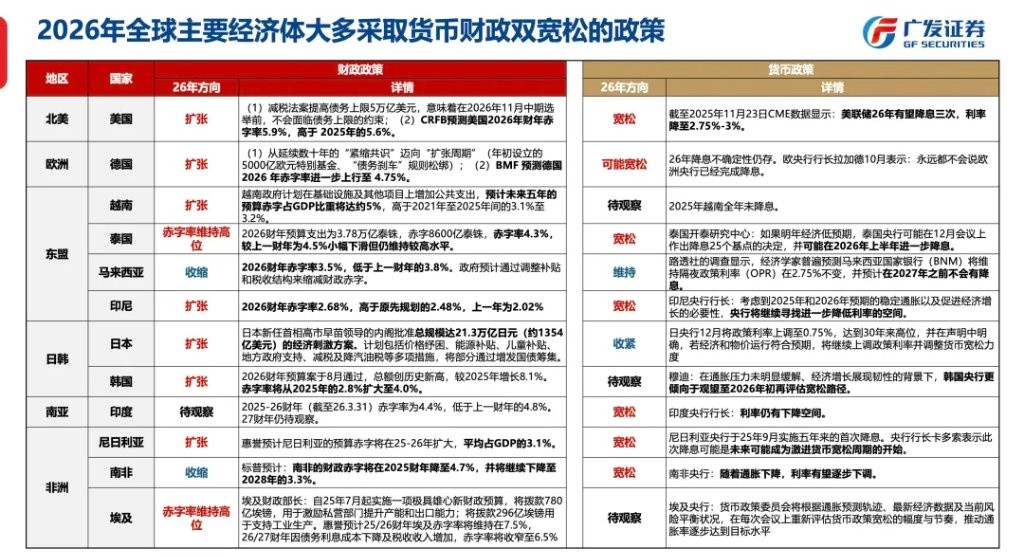
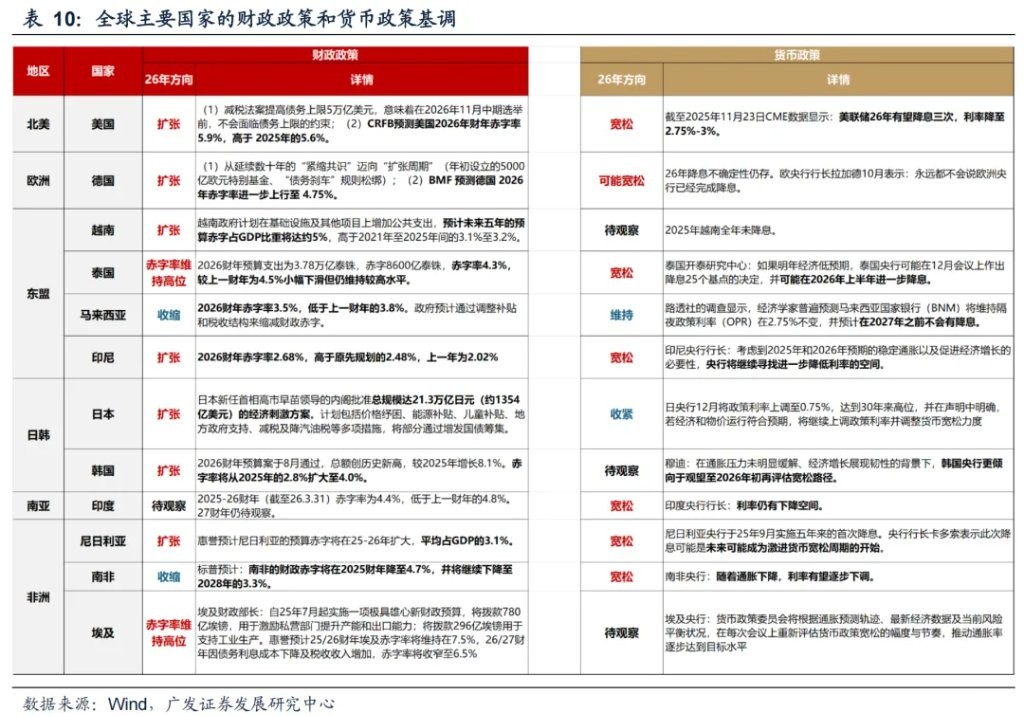
Looking ahead to 2026: It is expected that the Federal Reserve will cut interest rates twice in 2026; the European Central Bank may remain unchanged due to growth driven by German fiscal stimulus; the Bank of Japan may become the only major central bank to raise interest rates due to its inflation concerns and increasing pressure on the yen; most emerging markets are also in a loosening cycle, but may only loosen slightly, reflecting that their external demand has support but internal demand is relatively weak.
Risk Warning and Disclaimer
The market has risks, and investment should be cautious. This article does not constitute personal investment advice and does not take into account the specific investment goals, financial situation, or needs of individual users. Users should consider whether any opinions, views, or conclusions in this article are suitable for their specific circumstances. Investment based on this is at one's own risk
