
Is America's 2024 not a soft landing but a no landing?
Hello everyone, here is the core content of the weekly strategy report summarized by Dolphin:
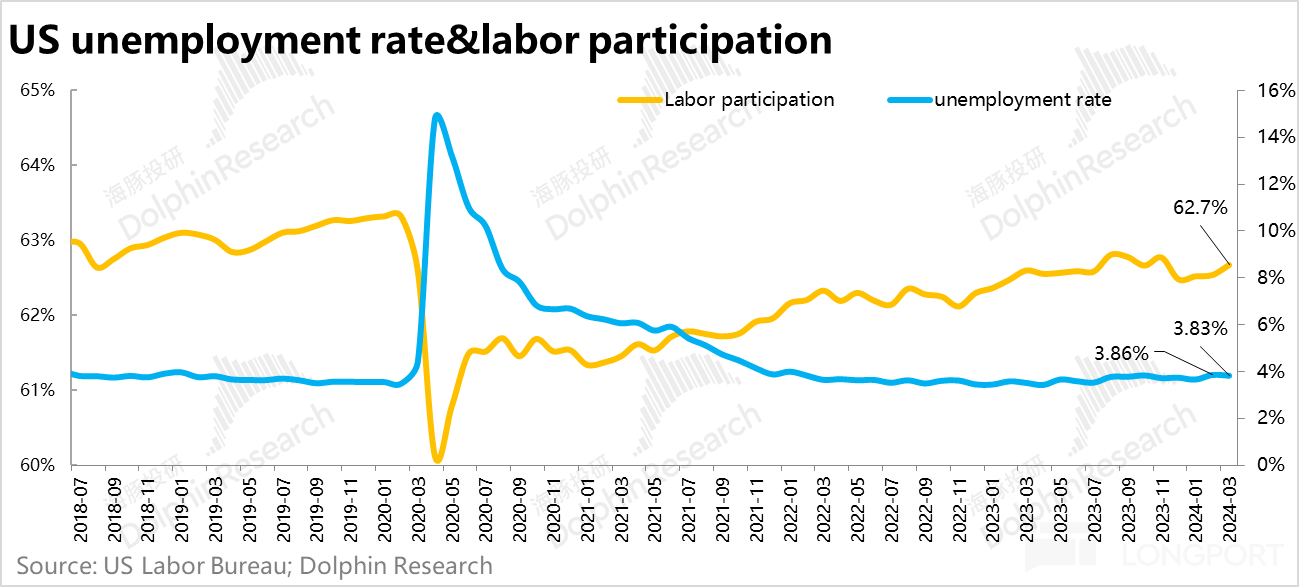
In March, the increase in new jobs was mainly driven by the rise in labor participation rate, indicating strong demand as usual, but with an increase in participation rate, the supply recovery momentum has increased.
Looking ahead to 2024 and comparing the employment levels in different industries with those of 2019, there are four industries with significantly higher job densities:
a. Construction industry: Infrastructure construction and manufacturing boom in the United States post-pandemic, as well as low real estate inventory.
b. Automotive industry: Inventory clearance was thorough before the pandemic, and the cycle is returning.
c. Business services: Consumer prosperity, affluent residents.
d. Healthcare and social assistance: Aging population and early retirement due to the pandemic.
These four post-pandemic economic characteristics, along with the ongoing AI technology wave, continue to be the driving force pushing the economy forward.
Although inventory replenishment has not yet begun, there have been leading signals in the PMI: the manufacturing PMI bottomed out in the second half of last year and has risen above 50 by March this year. As the PMI, acting as the core, has been trending upwards since the second half of last year and directly surpassed 50 in March, the risk of a downward trend in the service industry PMI is minimal.
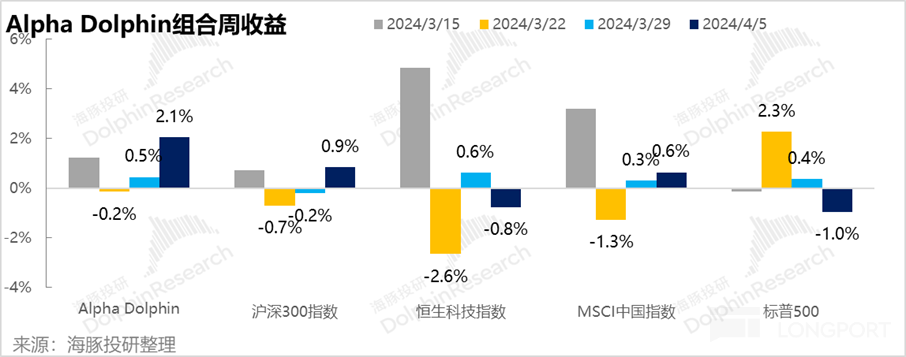
The representative indicator of market liquidity - bank reserve balances have not decreased, and the marginal changes in liquidity over the past five weeks have been mostly neutral. In a stable economic environment, although liquidity has been supportive since the beginning of the year, there has been a slight tightening trend in the past five weeks, but it is not significantly dragging down.
Here are the detailed contents:
Last week marked the beginning of the release of macroeconomic data for March, with two heavyweight economic data points - one depicting future trends (PMI) and one depicting past realities (employment and wages). The results for both data points were impressive.
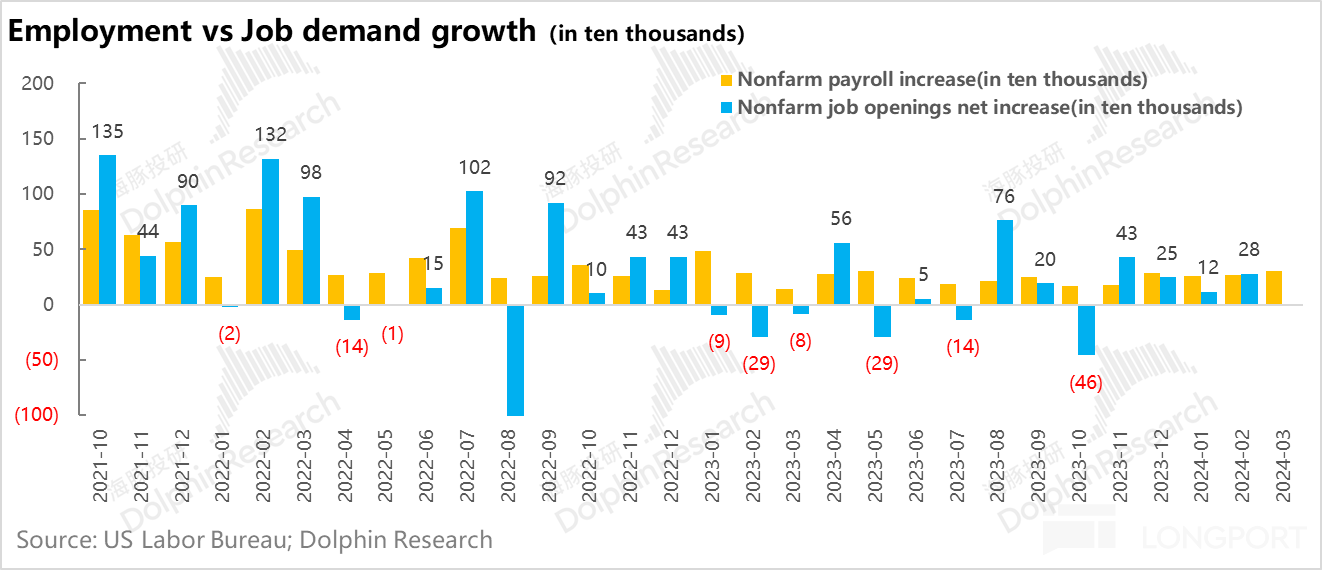
I. Behind the 300,000 new jobs in March: Is the economy stabilizing?
Although 300,000 new non-farm jobs is indeed a large number, due to the persistent labor market imbalance, this high number likely filled vacant positions in the labor market, easing the tightness in the job market.
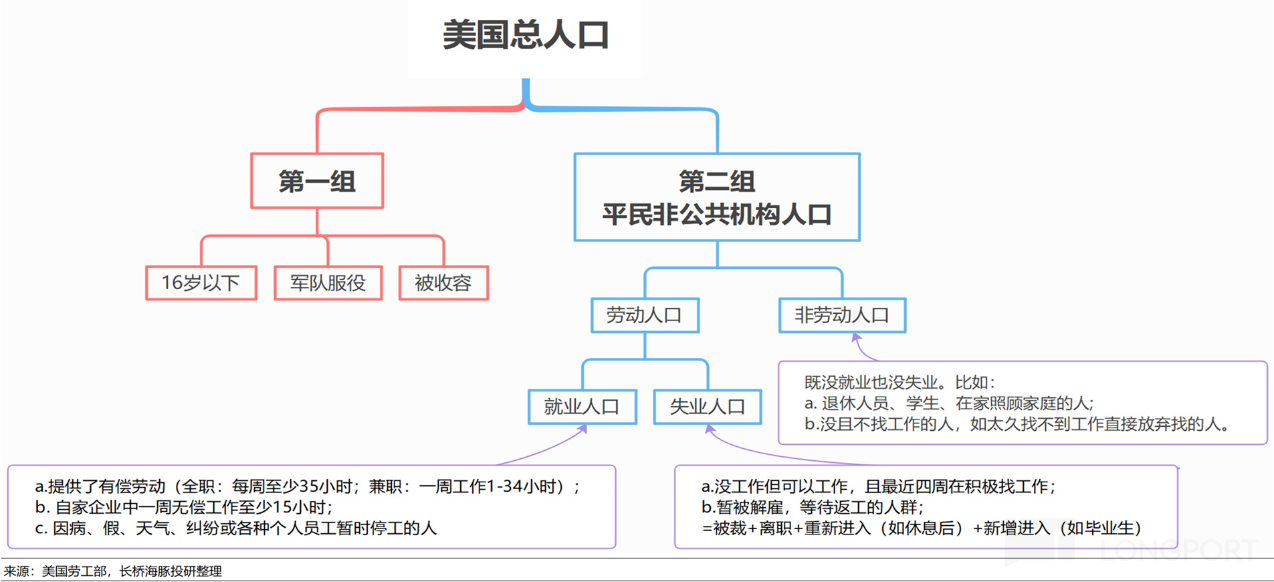
1.1 Changes in labor supply and demand
Regarding the source of these 300,000 net additions, from the supply side: a. The monthly labor force pool in the United States (labor force population + non-labor force population) adds approximately 170,000 each month; b. On top of this, the labor participation rate in March increased significantly.
This directly brought nearly 300,000 new labor forces to the market, with the remaining small gap being filled by the decrease in the unemployed population.
Overall, the increase in new jobs in March was mainly driven by the rise in labor participation rate, indicating strong demand as usual, but with an increase in participation rate, the supply recovery momentum has increased1.2 Industry Barometer Behind Employment: Construction Prosperity, Manufacturing Stability, Consumer Steadiness
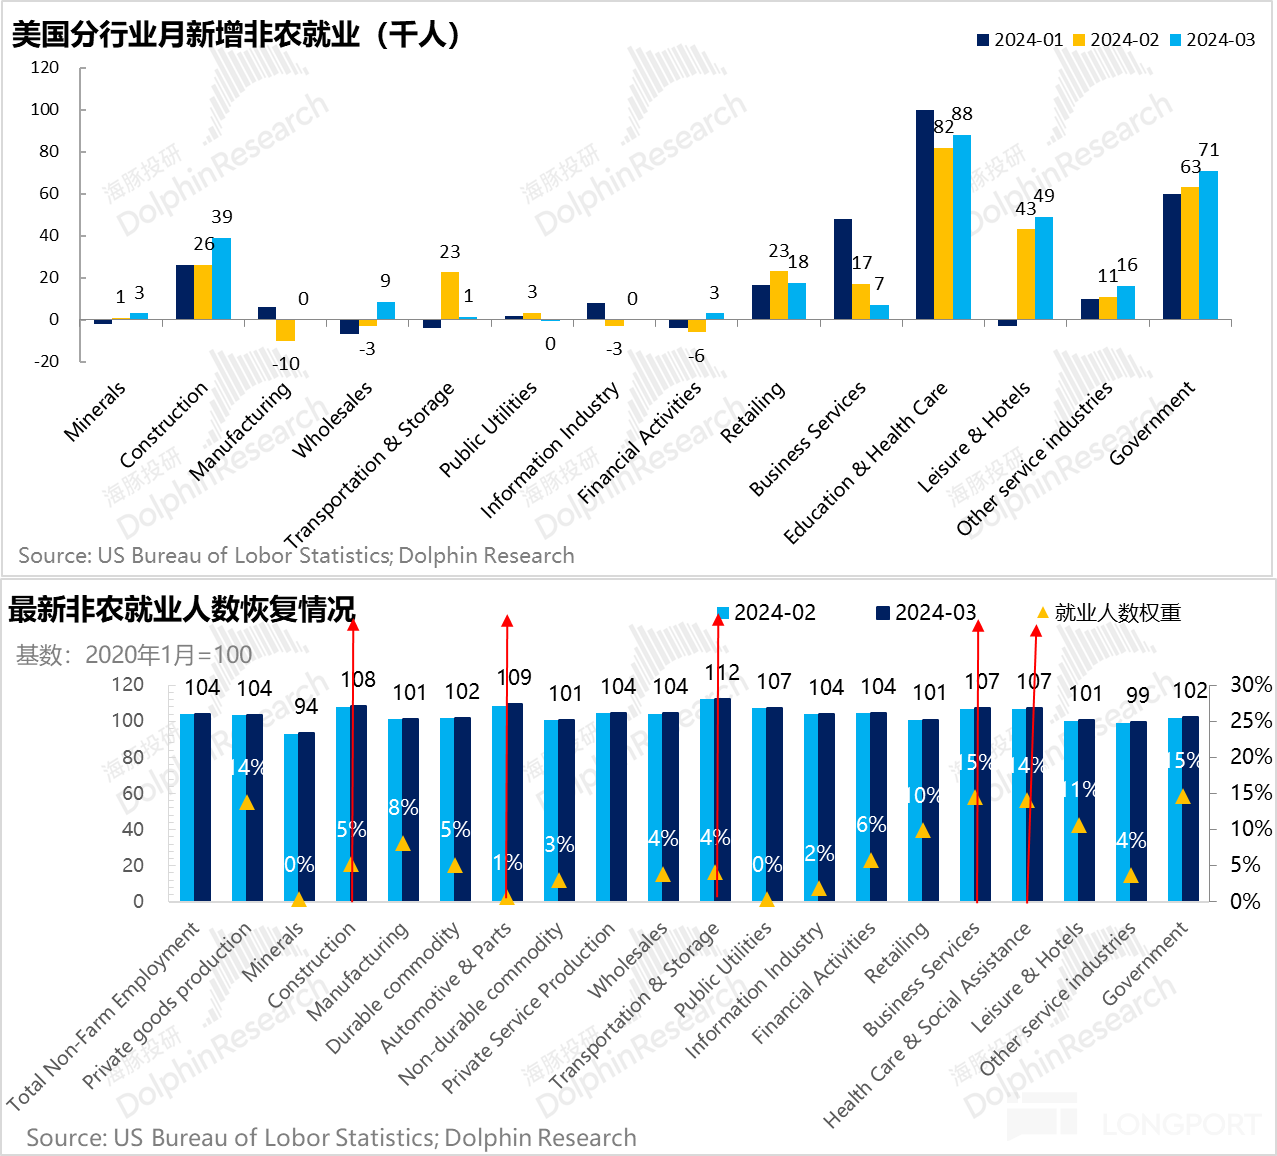
In March, there were over 300,000 new employments, compared to 270,000 in February. If non-agricultural employment is divided into five categories - private mining, private construction, private manufacturing, private services, and government positions, the additional 30,000 employments in March mostly came from the relatively upstream industries, especially construction and manufacturing.
The construction industry is experiencing prosperity, particularly after the return of real estate construction. Employment related to residential construction has increased significantly, and currently, the entire construction industry employment is in a phase of certain prosperity driven by manufacturing construction, infrastructure advancement, and the return of real estate. On the other hand, the manufacturing industry is more about marginal improvement, especially the employment recovery in automobile manufacturing.
Looking ahead to 2024 and comparing the employment levels in different industries with 2019, there are four industries with significantly higher employment density: a. Construction industry: Infrastructure construction and manufacturing boom in the U.S. after the epidemic, as well as low inventory in real estate
b. Automobile industry: Inventory clearance before and during the epidemic, cyclic return
c. Business services: Consumer prosperity, affluent residents
d. Healthcare and social assistance: Aging population and early retirement due to the epidemic
These four post-epidemic economic characteristics, along with the ongoing AI technology wave, continue to be the driving force for the economy to move forward. In 2024, there are no signs of economic weakening, but rather signals of marginal economic strengthening.
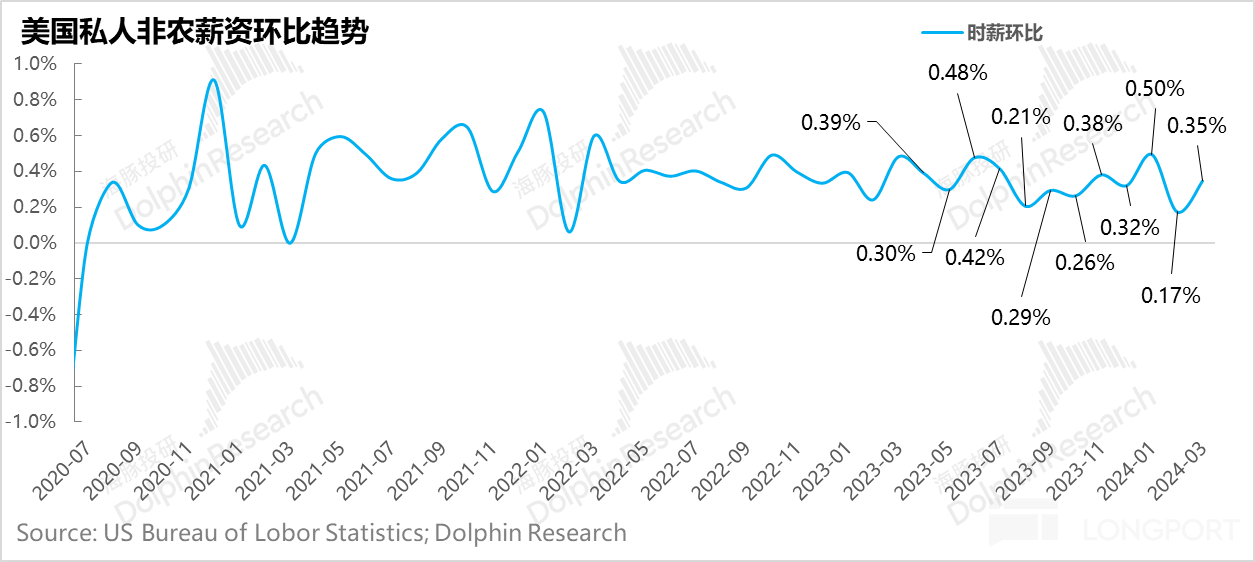
1.3 Decent Wage Growth
In March, the seasonally adjusted hourly wage increased by 0.35% month-on-month. Due to the relatively small increase in the previous month, when annualized for the first three months, it is roughly equivalent to a 4.1% year-on-year growth, consistent with the current year-on-year expectations, but higher than the fluctuation range of about 2.5%-3.5% before the epidemic. Moreover, looking at the current employment situation, further downward movement to return to pre-epidemic levels is somewhat challenging2. Manufacturing PMI is Back
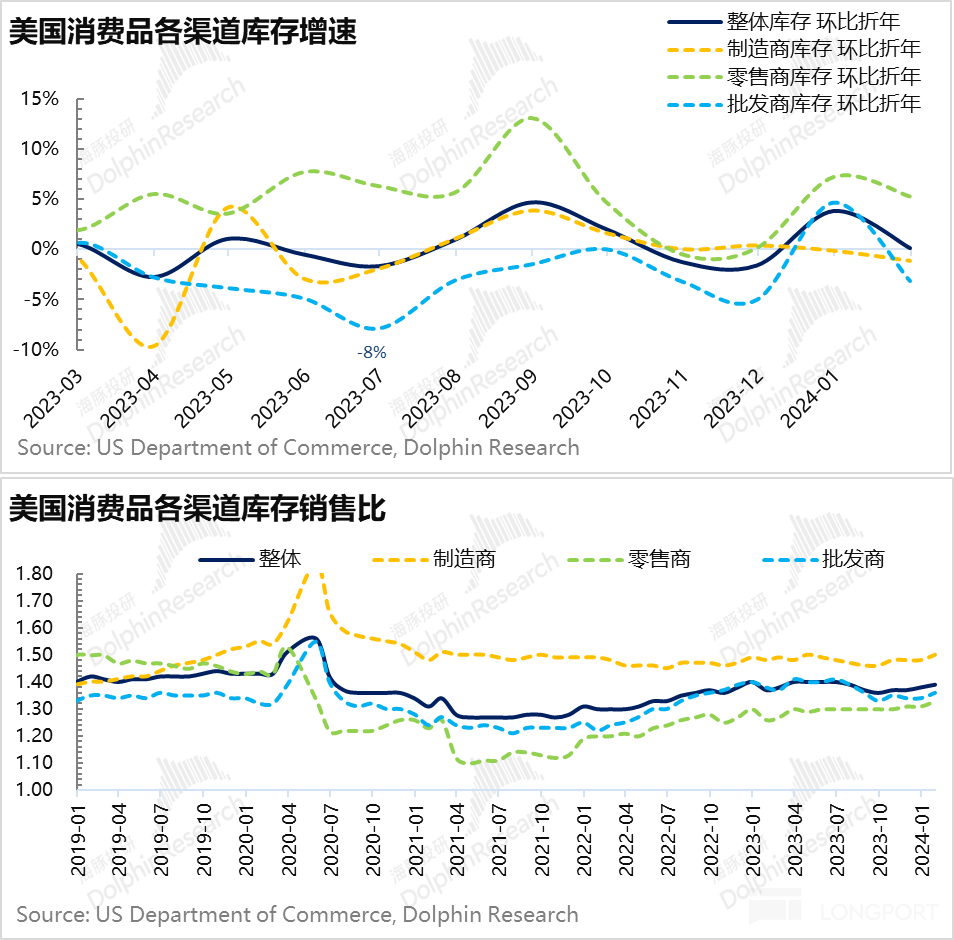
Before discussing the PMI for March, let's first review the retail inventory status in the United States as of January. Looking at manufacturers, retailers, and wholesalers, retailers at the downstream level have basically cleared their inventory, showing signs of actively replenishing, but due to the slow expansion of social credit under high interest rates, the replenishment action is exceptionally slow. The inventory levels at the wholesale and manufacturing levels are still relatively high, requiring downstream digestion.
Overall, the overall retail inventory in the United States is coming to the end of destocking and entering a stage of structural optimization, with overall restocking yet to begin.
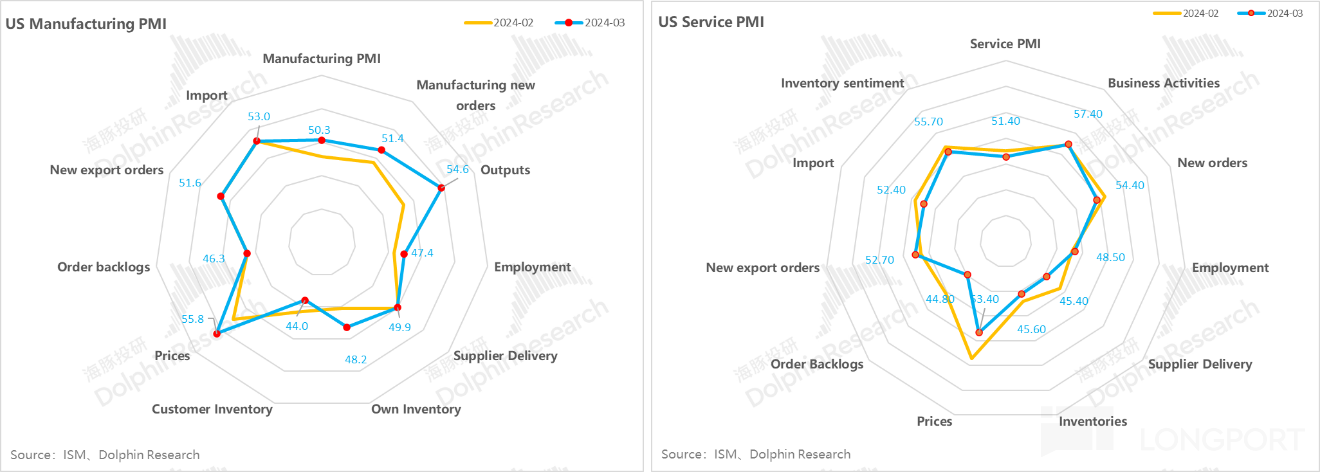
Although restocking has not yet begun, there are early signals in the PMI: the manufacturing PMI hit bottom in the second half of last year and has returned to above 50 by March this year.
In key sub-items, new orders received by manufacturing enterprises in the past three months, except for dropping below 50 in February, have been in an expansion state in January and March, with prices expanding for three consecutive months.
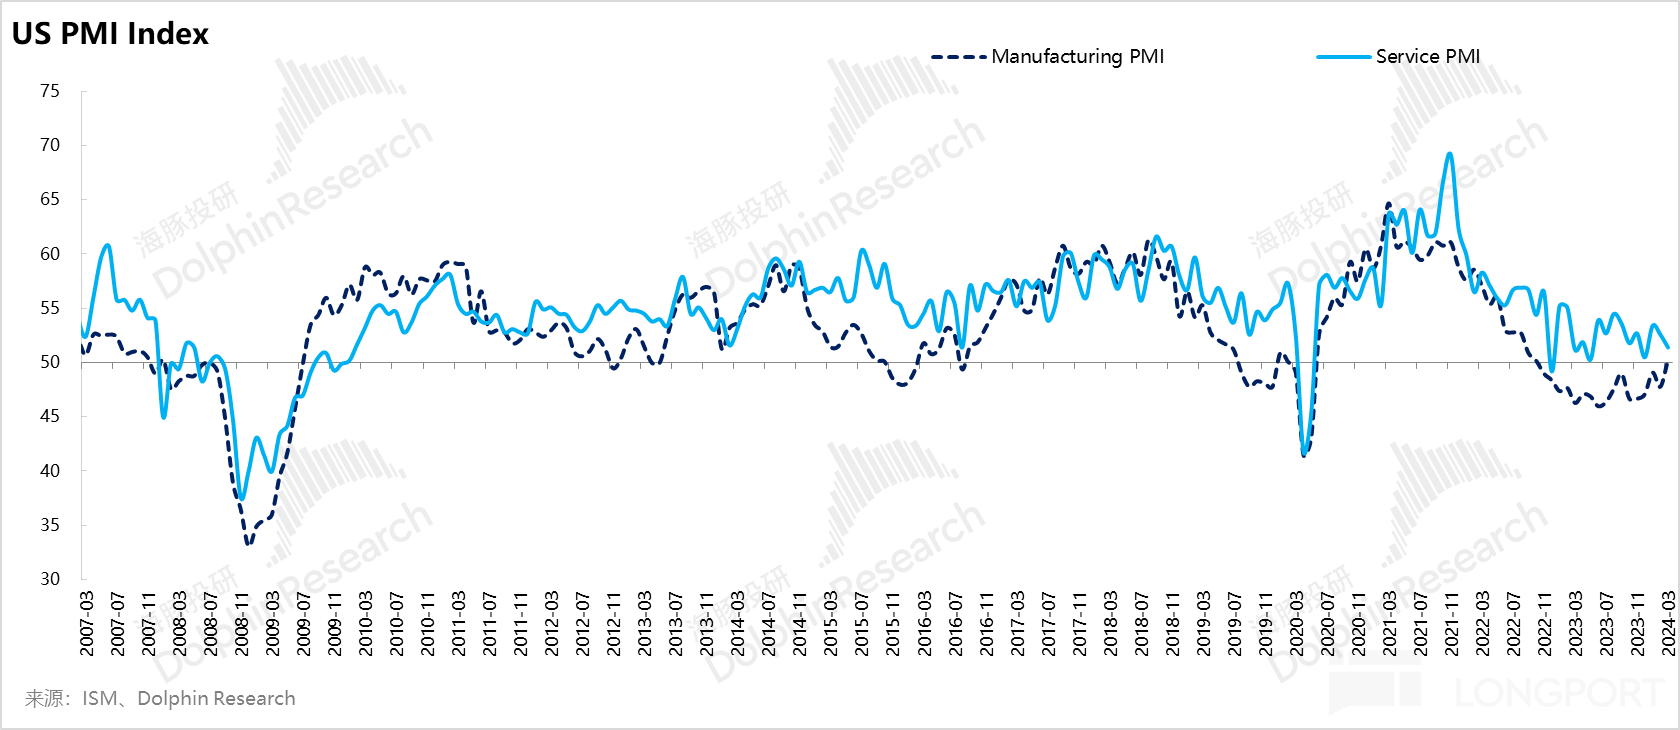
In addition, the manufacturing PMI returning to above 50 has also to some extent ended the possibility of the service industry falling below 50. Looking at several rounds of major economic recessions, the manufacturing PMI has always led the decline in each cycle, with a deeper decline and higher elasticity in the recovery process compared to the service industry PMI, similar to a gravitational force, where the decline in the manufacturing PMI will pull the service industry down.
With the PMI showing a rising trend since the second half of last year and directly surpassing 50 in March this year, the risk of the service industry trending downwards is now minimal.
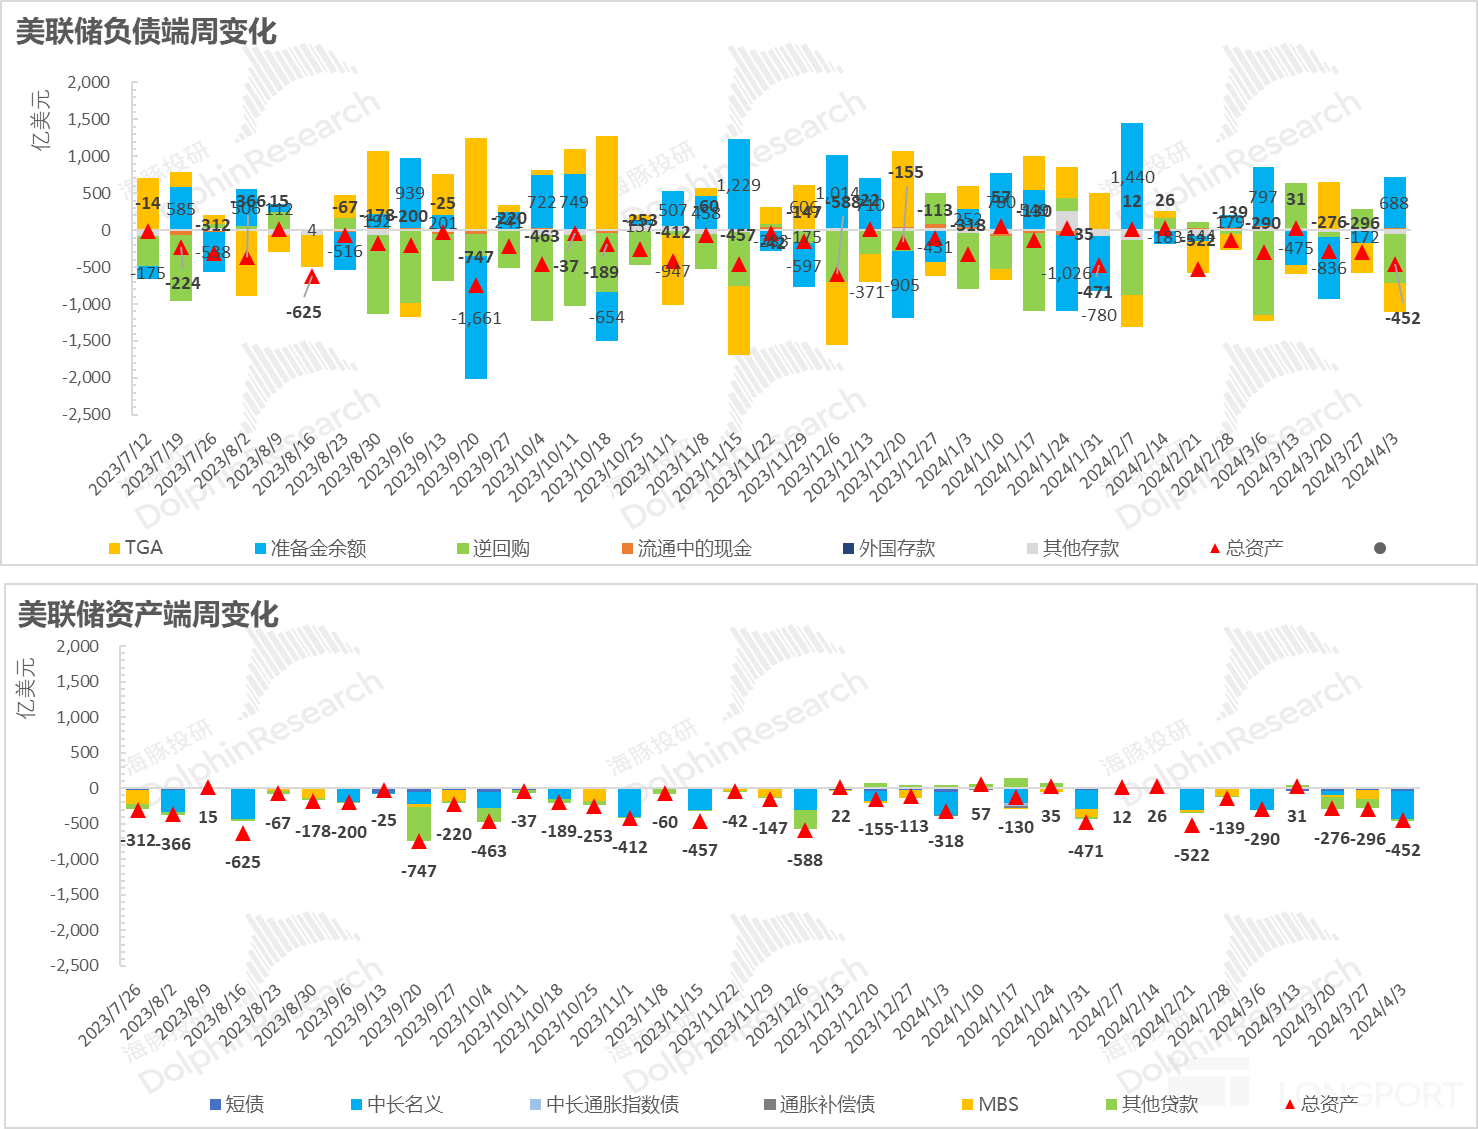
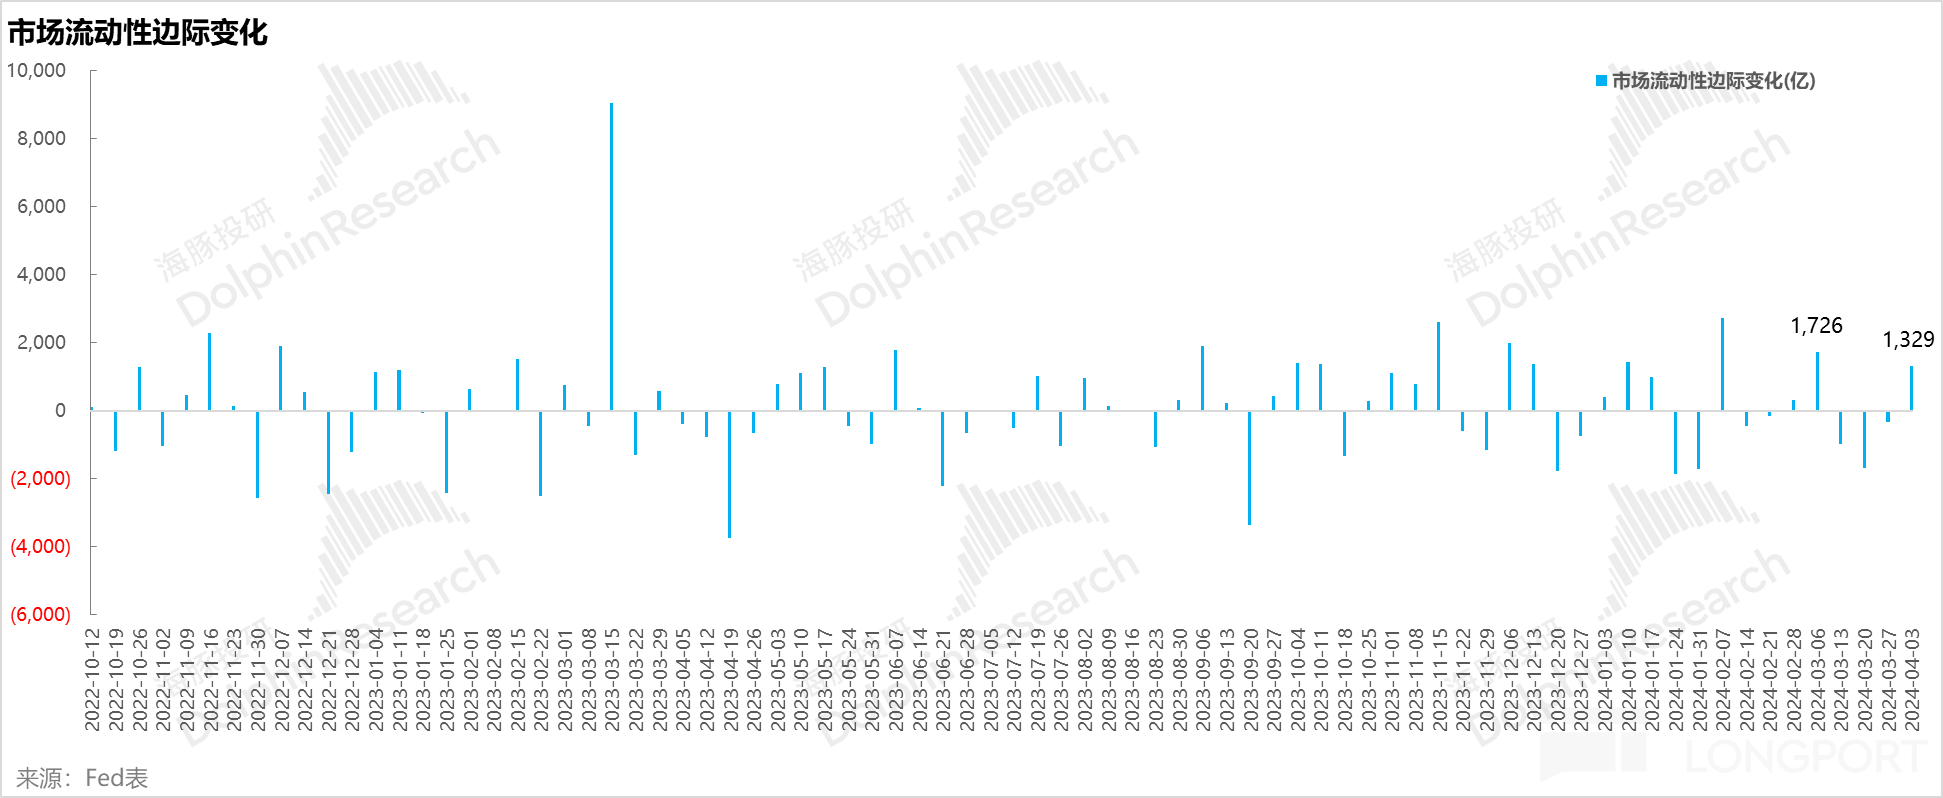
3. Liquidity: Reverse Repurchase + TGA to the Rescue
Although the balance of loans assisted by medium and small banks (BTFP) did not decrease last week, the Federal Reserve's sale of medium and long-term nominal Treasury bonds has resumed, resulting in a much faster overall balance sheet reduction by the Federal Reserve in the past three weeks.
However, the reduction speed of reverse repurchase agreements is still relatively controllable, and there are even signs of slowing down, mainly because the TGA account balance (due to the recovery of fiscal income) during this period is relatively high, which can offset the impact of the Federal Reserve's balance sheet reduction along with reverse repurchase agreementsMarket Liquidity and Reserve Requirement Balance
In the end, the representative indicator of market liquidity - the bank reserve balance did not decrease, and the marginal change in liquidity in the past five weeks was basically neutral. Therefore, with a stable economic foundation, although the current liquidity is supportive at the beginning of the year, it has not had a significant impact on the market in the past five weeks.
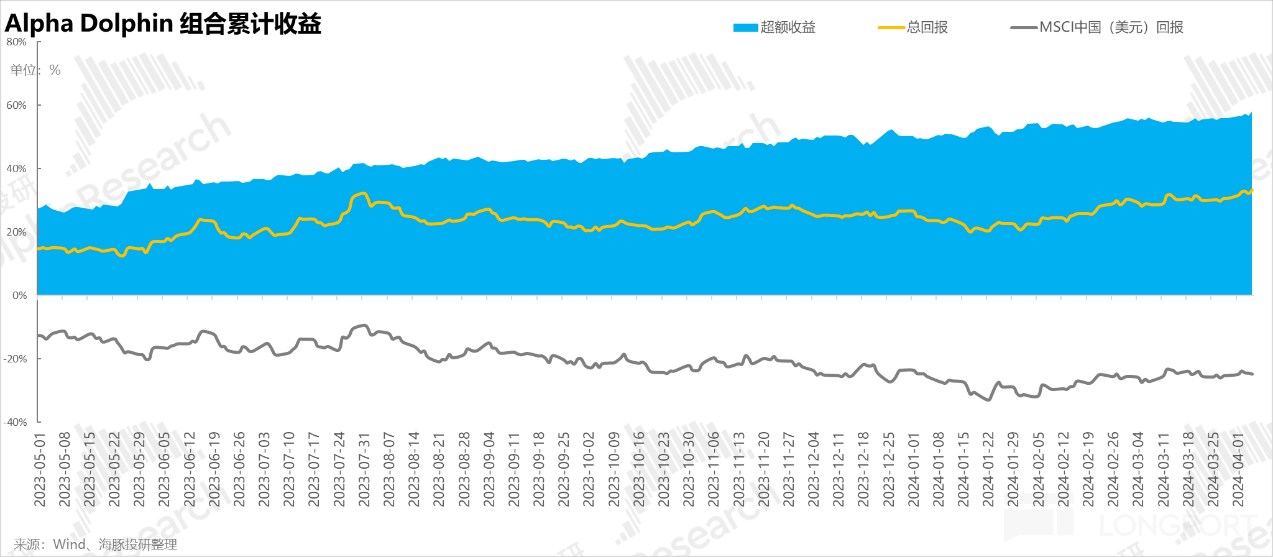
Portfolio Rebalancing and Returns
On April 5th, Alpha Dolphin's virtual portfolio did not rebalance. By the end of the week, the portfolio's return increased by 2.1%, outperforming most benchmark indices: S&P 500 (-1%), Hang Seng Tech Index (+0.6%), MSCI China (+0.3%), and CSI 300 (-0.2%).
Absolute and Excess Returns of the Portfolio
From the start of the testing period to the end of last week, the absolute return of the portfolio was 33%, with an excess return compared to MSCI China of 58%. From the perspective of asset net value, Alpha Dolphin's initial virtual assets of $100 million have now risen to $135 million.
Individual Stock Profit and Loss Contribution
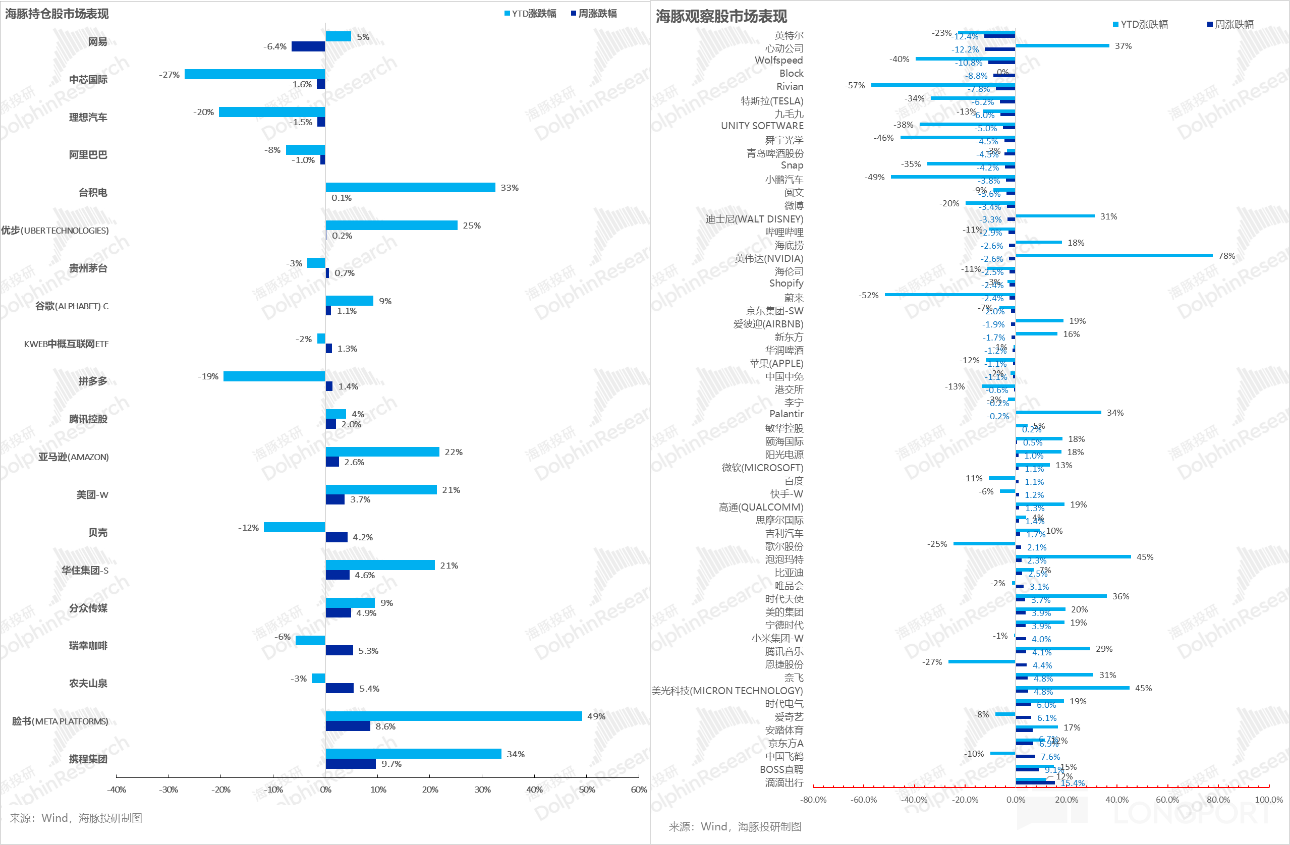
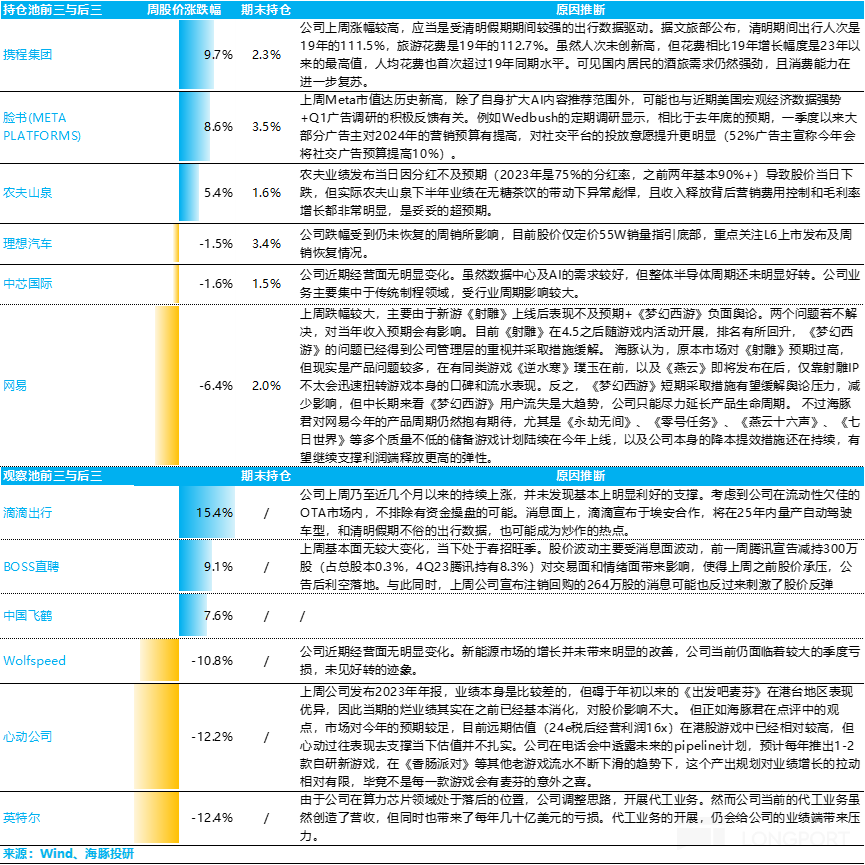
Last week, the U.S. stock market declined, with Chinese concept stocks relatively weak. However, the Alpha Dolphin portfolio achieved significant excess returns, mainly due to the rebound in tourism and consumption in the portfolio holdings, while other performances remained stable, except for a significant decline in NetEase.
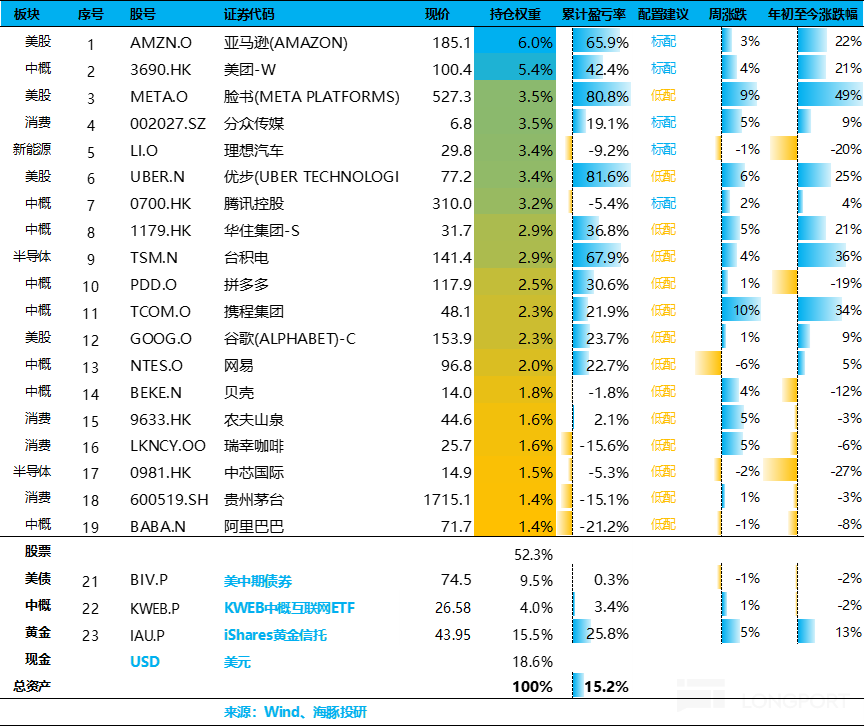
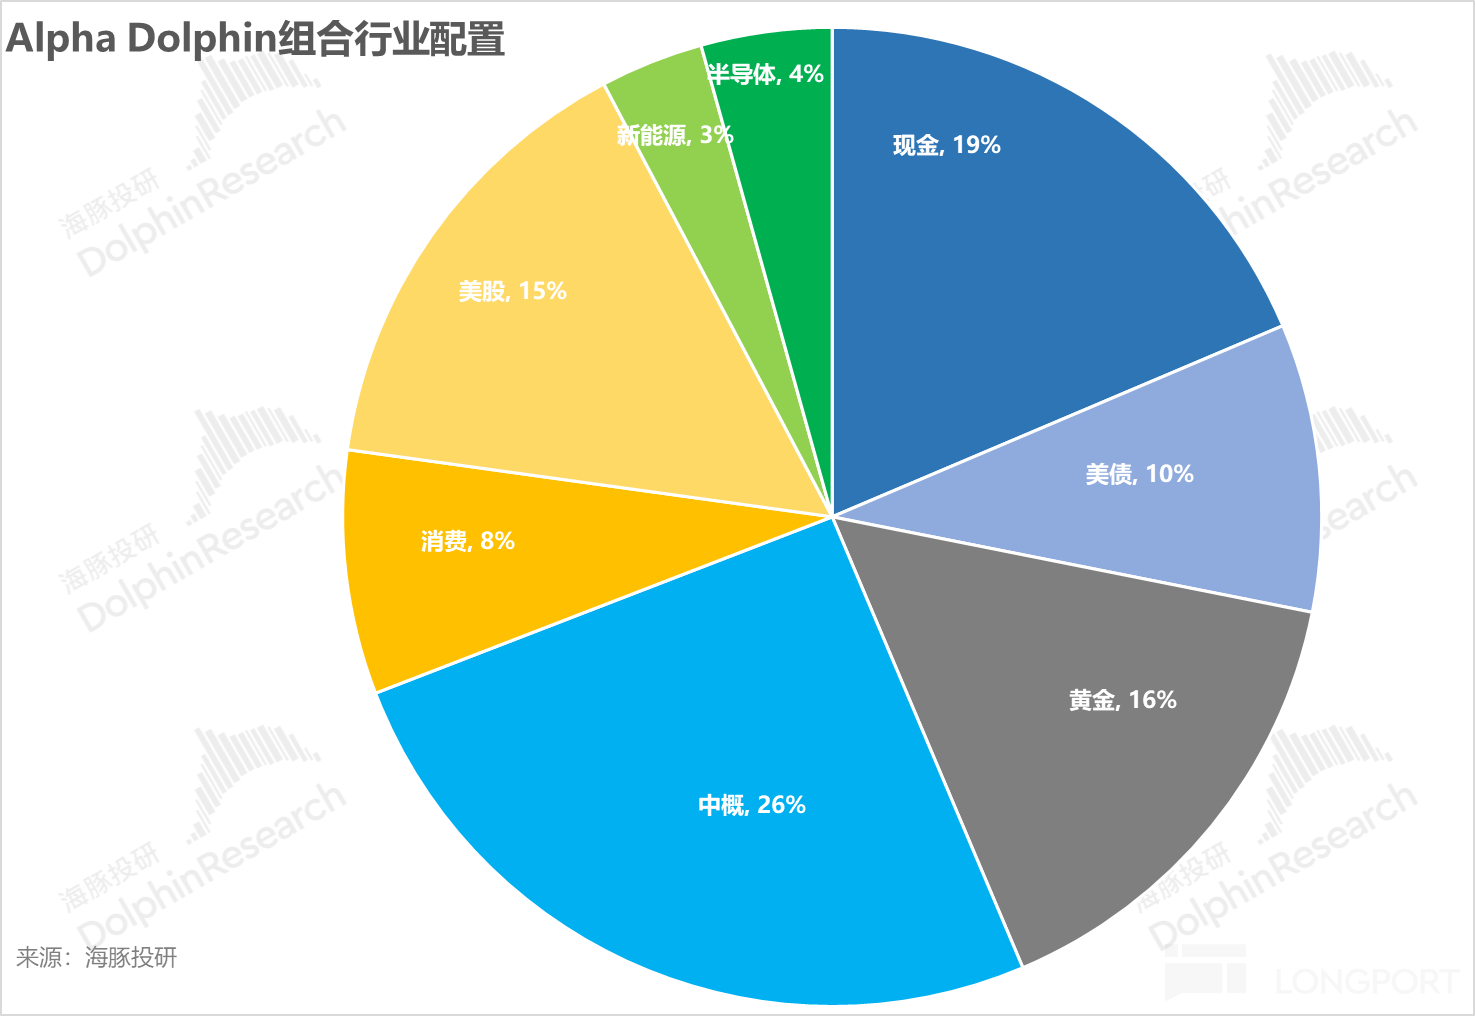
Portfolio Asset Allocation
The Alpha Dolphin virtual portfolio holds a total of 20 individual stocks and equity ETFs, with 6 core holdings and the rest as underweight equity assets, along with holdings in gold, U.S. bonds, and U.S. dollar cashAs of last weekend, the asset allocation and equity asset holding weights of Alpha Dolphin are as follows:


End of text
Risk Disclosure and Statement for this article: Dolphin Investment Research Disclaimer and General Disclosure
For recent articles from Dolphin Investment Research, please refer to:
- "Earn more and spend more, why do American residents consume so fiercely?"
- "Counting on a big dip in US stocks? Not very hopeful"
- "Low-grade fever of US inflation, can Chinese concept stocks still rise?"
- "Dare not chase after the seven tech sisters? Chinese concept stocks unexpectedly benefit"《Enterprise Relay Residents Support the Economy, the United States Will Not Cut Interest Rates Quickly》
《Giants Stagnate, Chinese Concepts Rise, Is it a Last Gasp or a Style Switch?》
《2024, Will the U.S. Economy Avoid Landing?》
《Another Critical Moment! Will Powell Bail Out Yellen, the Prodigal Daughter?》
《Seeing Mud and Sand Together Again, How Much Faith Can Withstand the Test?》
《Unstoppable Deficits, Holding Up the Dignity of U.S. Stocks》
《2024 United States: Good Economy, Quick Interest Rate Cuts? Too Beautiful, Will Suffer Losses》《2023 US Suicide Rebirth》
《Fed Makes a Sharp Turn, Can Powell Resist Yellen?》
《Year-end US Stocks: Small Rise is Comforting, Big Rise is Harmful》
《Consumer Cooling Off, Is the US Fed Really Just a "Hard-mouthed" Fed Away from Rate Cuts?》
《US Stocks Overdrawn Again, Finally the Opportunity for Chinese Concepts》
《US Stock "Sun Never Sets" Faith is Back, Is it Reliable this Time?》《High Interest Fails to Extinguish Consumption, Is the United States Really Strong or Just Hype?》
《Second Half of Tightening by the Federal Reserve, Neither Stocks nor Bonds Can Escape!》
《This is the Most Down-to-Earth, Dolphin Investment Portfolio Sets Sail》