
Earning More, Spending More: Why is U.S. Consumer Spending Still So Strong?
Hello everyone, the following is the core content of the weekly strategy report summarized by Dolphin:
- US Personal Consumption Expenditures in February: With a tight job market, residents have a stable current income-earning ability. Despite the gradual increase in income being eroded, disposable income growth remains good.
With a tight job market as a guarantee, residents have the confidence to spend money, leading to faster expenditure growth. Ultimately, for every $100 earned, only $3.6 can truly be saved, as Americans are not saving much.
- Looking at the residents' balance sheets, the truth about their ability to spend more comes out: Apart from feeling secure, the total amount of deposits held by Americans relative to their total debt repayment capacity is still much higher than before the pandemic. This not only explains why consumption has been continuously squeezing savings, but also allows for a reasonable judgment that consumption can continue to be squeezed for the rest of the year.
This indicates that as long as employment remains stable and residents have excess repayment capacity on their balance sheets, one should not expect a significant slowdown in the largest driver of US economic growth - domestic demand.
- The core PCE inflation rate in February fell to 0.26%, although still relatively high, it is not considered to exceed market expectations given the previous groundwork. Thus, the annualized core PCE rate for the three months ending in February is actually 3.5%, not the 2.6% expected by the Federal Reserve for the full year.
With the current strong fundamentals of the US economy, coupled with potential rate cuts ahead, Dolphin Jun is not easily convinced by the Fed's statement that the inflation in January and February is just a minor fluctuation on the path of inflation.
- Looking at the current trend, the US asset market still has a strong economic foundation and loose liquidity to provide dual support. In this scenario, the US capital market in the first and second quarters may perform well. Without significant fiscal bloodsucking, there is no sign of a major correction in the equity market. Instead, there are more opportunities to explore companies with strong performance delivery for excess returns.
Here are the detailed contents:
By the end of last week, all economic data for February in the US had been released, including the most important data on residents' income and expenditure. The fact is, when residents have job security and money in their pockets, as a consumption-driven economy, the US does not face significant economic growth pressure.
I. Household Sector: Able to earn, able to spend, feeling secure
Although retail sales data for January and February remained weak, looking at the final income and expenditure of residents in February, their consumption power remains strong:
After the pandemic, wage income relayed transfer payments, with a robust increase in wage income in February - a month-on-month growth rate of 0.7%, resulting in a net increase of $100 billion for all residents. While asset income (interest, dividends, etc.) has decreased, the annualized income increment for US residents in February is still $66 billion.
After residents receive income, they pay taxes, form their disposable income, pay interest, and what's left is for consumption and savings (including investments). Due to the low debt ratio of residents during this cycle and the fact that residents' loans are not high in a high-interest environment, even with high interest rates, the pressure to pay interest is not significant In terms of personal income tax expenditures, during this period, especially since January, the growth has been relatively high (corresponding to the government's fiscal revenue since the beginning of the year is still good), but relying on continuous squeezing of the savings rate, residents' consumption expenditure is quite strong.
This trend is even more pronounced in February: not only has the additional income been almost entirely consumed by the marginal growth of residents' consumption, but it has also further squeezed the savings rate.
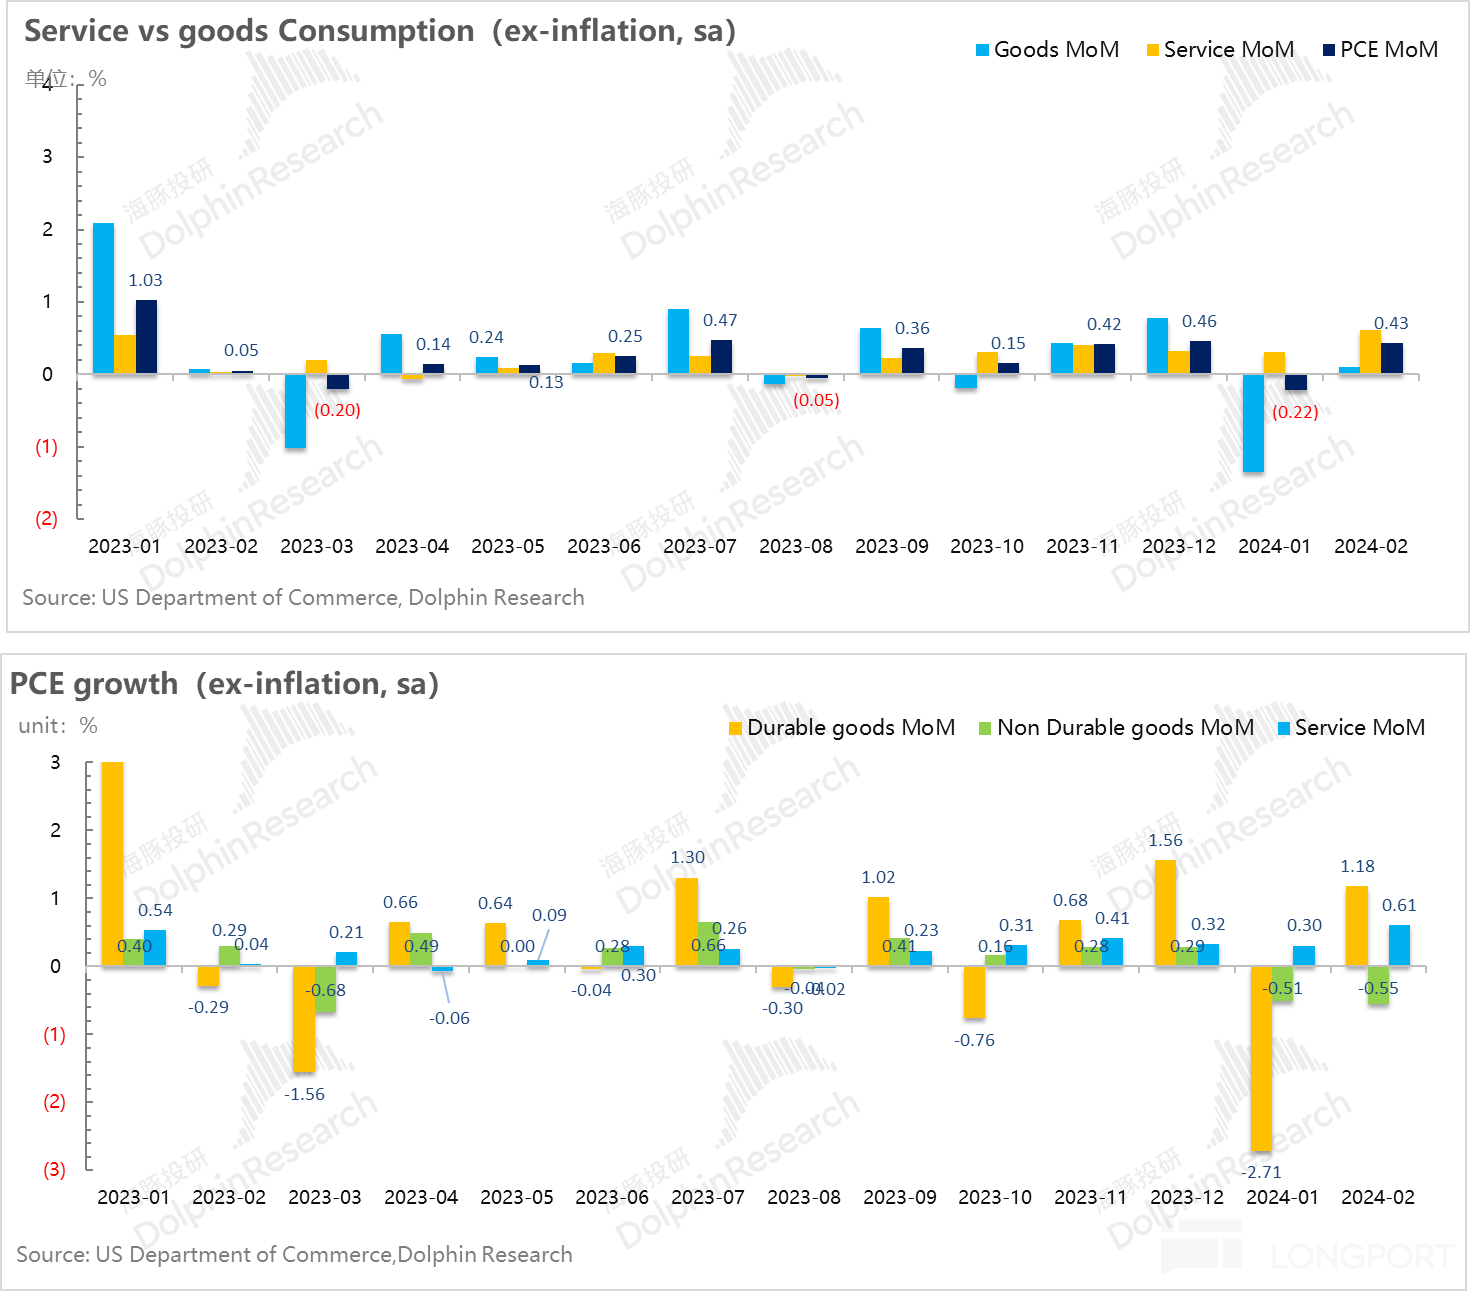
This has led to another significant decline in the residents' savings rate in February, which has been squeezed to 3.6%, a decrease of 0.3 percentage points compared to the previous month. Therefore, although commodity consumption was weak in February, the overall residents' consumption, including services, was very strong.
After adjusting for inflation, seasonally adjusted residents' consumption in February rebounded to 0.43% (equivalent to a year-on-year increase of over 5%), returning to a relatively strong growth trajectory. As known, physical retail is relatively weak, and the true driving force behind residents' consumption in February remains service consumption.
The overall residents' income and expenditure statement for February (which can be regarded as the residents' monthly profit and loss statement) is as follows:
a) In a tight job market, residents have a stable current income-generating ability. Even though the gradually increasing income has been skimmed off a layer, the growth of disposable income is still good.
b) With a tight job market as a guarantee, residents have the confidence to spend money, leading to exaggerated expenditure growth. Ultimately, the amount of money that can truly be saved from the income earned in the current period (whether in bank deposits or investments) is decreasing: for every 100 yuan earned in February, only 3.6 yuan is saved.
II. How Long Can Residents Continue to Squeeze Savings?
In February, it is evident that as the most primitive driving force of consumption, one comes from wage growth, and the other comes from squeezing savings. Wage growth can be predicted in advance through the monthly addition of non-farm employment and hourly wage growth rates.
The main issue currently lies in the second aspect. Why, in the midst of this strong economic growth in the United States, do American residents continue to squeeze the savings rate, shifting towards releasing consumption, allowing the growth rate of residents' consumption to continue to exceed the growth of current income?
In the article "Enterprise Relay Supports the Economy, U.S. Rate Cuts Won't Happen Quickly" at 《企业接力居民撑经济,美国降息不会快》, Dolphin has previously expressed concerns about the increase in credit card default rates and bad debt conversion rates, as well as the issue of excessive savings in household consumption being almost depleted. It seems that by February, this issue has not yet emerged.
Therefore, in addition to focusing on household income statements, Dolphin has now added a focus on household balance sheets. It is here that Dolphin truly quantitatively feels the strength of the U.S. household balance sheet after this epidemic.
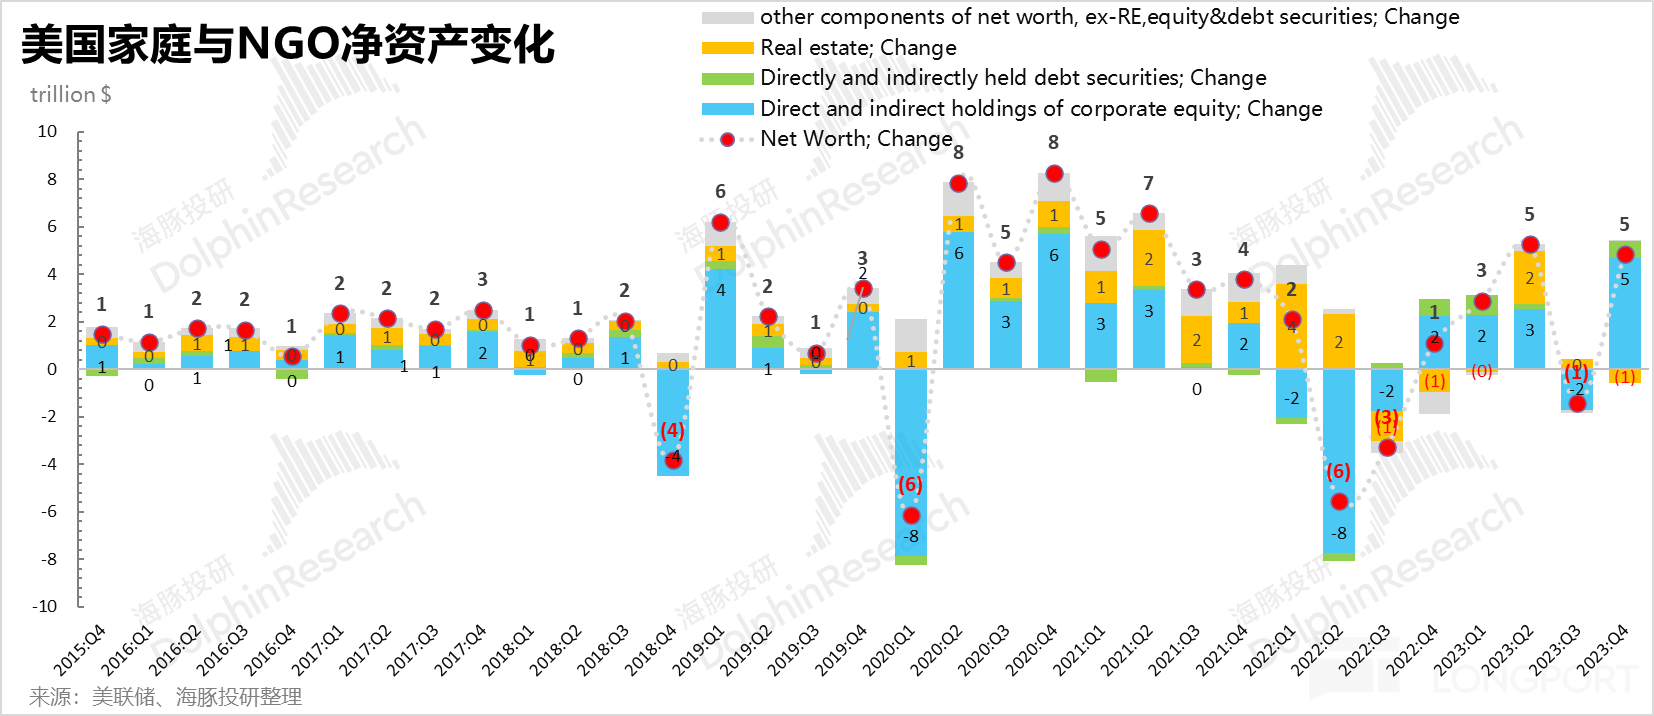
Taking the fourth quarter of last year as an example, in the U.S., non-financial assets of households are mainly real estate, accounting for approximately 25% of total assets; under the pressure of high interest rates, this part has not appreciated, and the asset amount has remained basically unchanged over the past year.
The core wealth of households is mainly concentrated in financial assets, apart from deposits, most of which can be traced to equity and bond assets.
Because the main assets of American households are in financial assets, especially with a high proportion of equities, the asset inflation effect on households is very obvious. At the same time, due to high interest rates, the increase in household debt has been suppressed. The current result of the U.S. household balance sheet is a typical household balance sheet inflation effect:
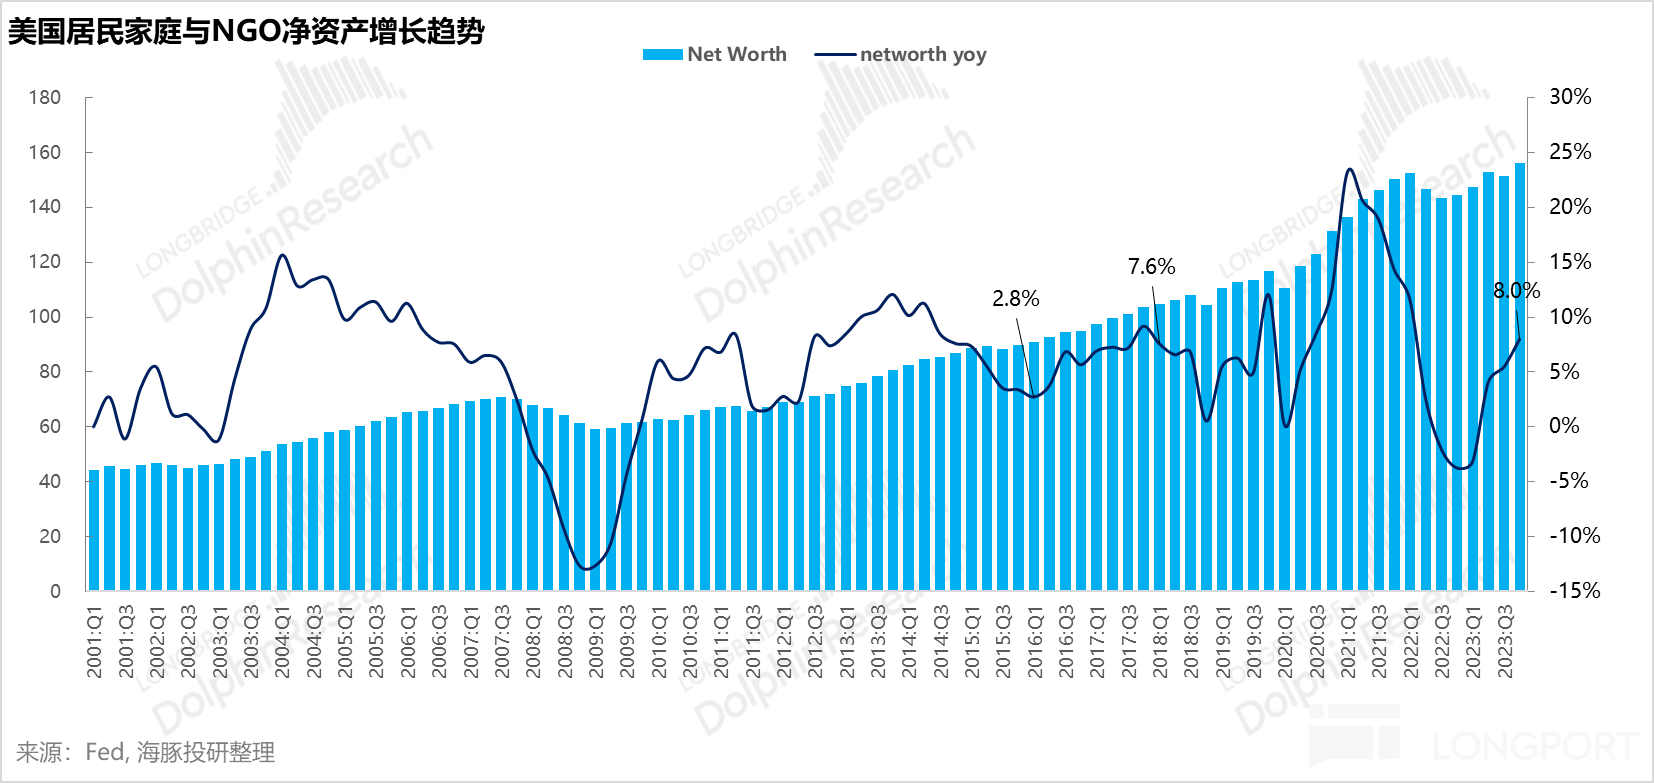
While household assets are inflating, household leverage is automatically contracting (debt remains the same, while assets grow rapidly), resulting in higher net assets, making the household balance sheet stronger and stronger.
High net assets also depend on the liquidity of assets. After all, consumption requires cash flow to pay for it. The essence is to see how much consumption squeezes the space for savings, which fundamentally depends on how much cash assets are on the household balance sheet. It is also at this point that Dolphin understands why it is not surprising that the savings rate continues to drop to 2% at this stage.
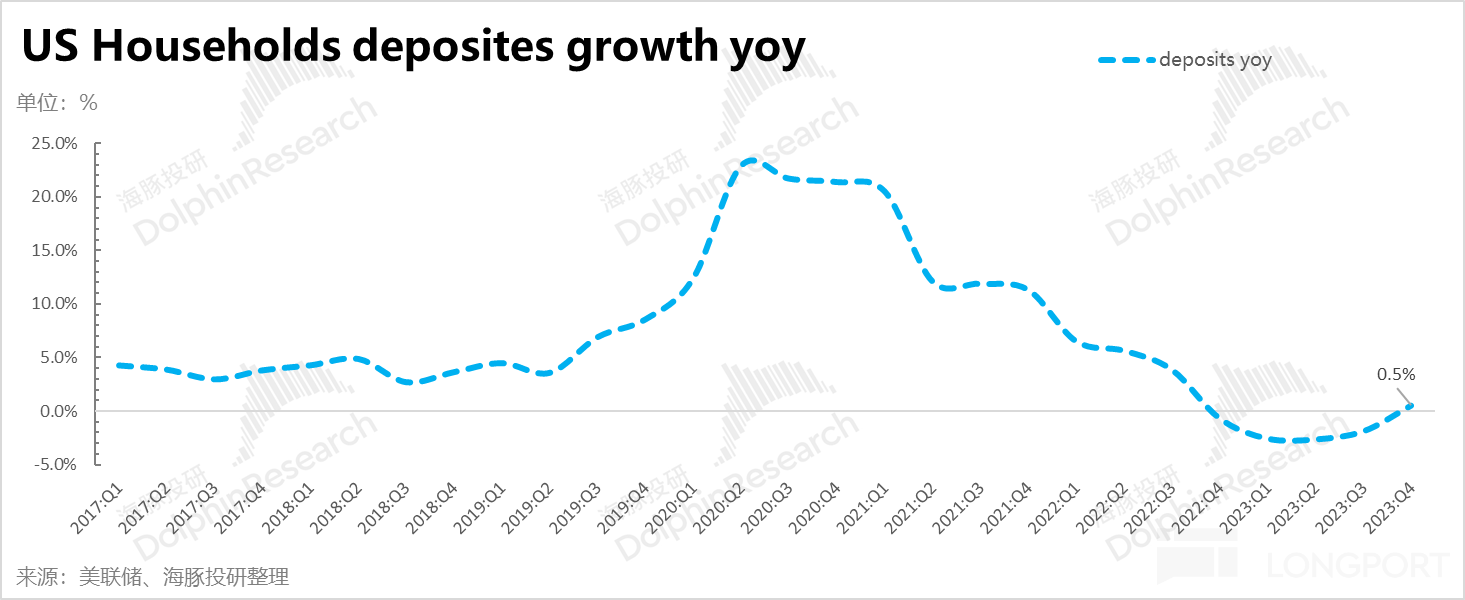
Firstly, because households have spent most of their current income, they have not left much for savings. The money flowing into their savings accounts is decreasing. This result is reflected in the household balance sheet, where household savings (deposits) have basically zero year-on-year growth, and are even gradually decreasing.
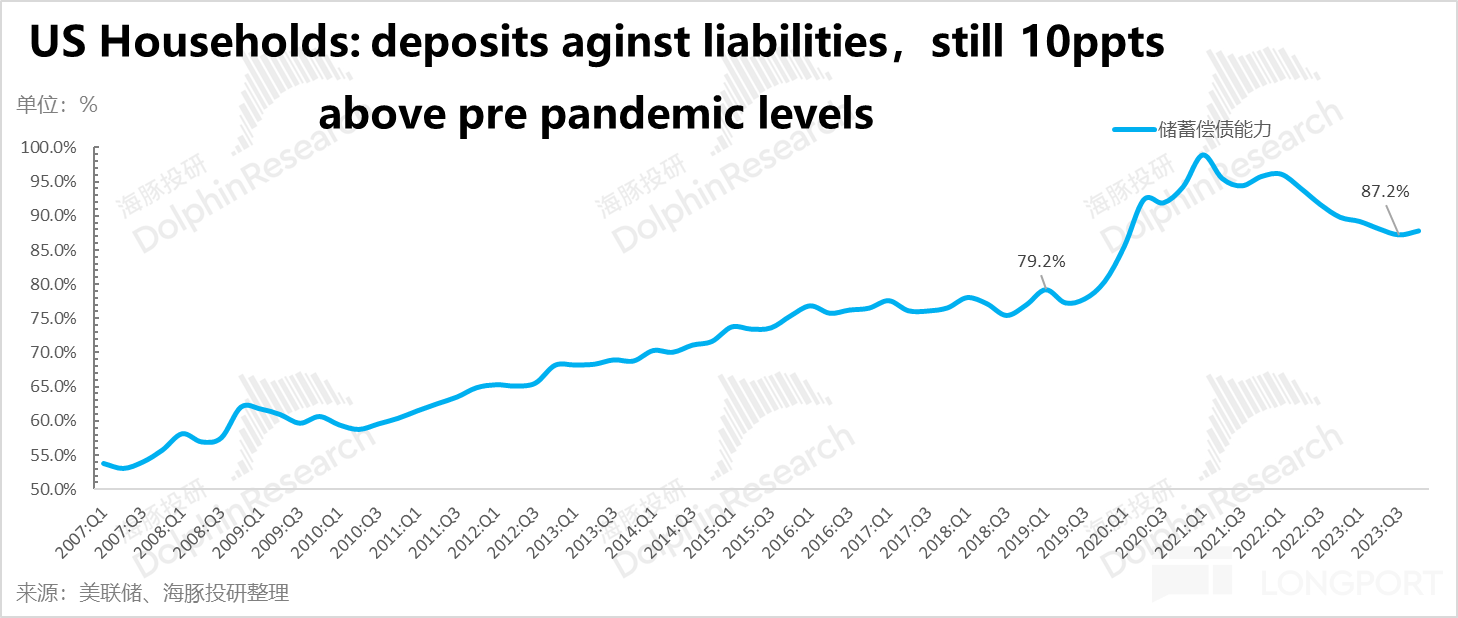
However, even if the deposit balance does not increase, the repayment capacity of American households (the ratio of deposit balance to total household debt) is still far above pre-epidemic levels, by around 10 percentage points If assets can expand due to real estate and the stock market, with high volatility and some room for manipulation, deposits and liabilities, on the other hand, are fixed values that do not fluctuate with asset appreciation or depreciation. The debt repayment capacity of residents is a high certainty hard indicator.
This indicator still far exceeds the pre-epidemic level, explaining not only why consumption continues to squeeze but also with subsequent interest rate cuts, it can be reasonably judged that American residents will continue to experience consumption squeezing savings this year, driving consumption expenditure growth to remain higher than income growth.
In other words, as long as employment remains stable this year, residents themselves have excess solvency on their balance sheets. Do not expect American residents' consumption in 2024 to deteriorate significantly.
II. Prices: Fortunately, PCE prices did not soar beyond expectations
After consecutive months of CPI prices exceeding expectations, the good news is that core PCE prices in February remained relatively under control.
Taking a closer look at the PCE price index calculated from consumer spending: the month-on-month growth rate of core PCE in February fell to 0.26%. Dolphin calculated that the quarterly annualized rate of core PCE up to February was 3.5%, which indeed slowed down significantly compared to January. However, the key issue lies in the future trend.
If inflation does not further decline but hovers around this level, along with an assumed natural economic growth rate of around 1.5%, the corresponding interest rate would actually be around 5%, corresponding to the current real policy interest rate of around 5.3%. It seems that there is not much room for further rate cuts.
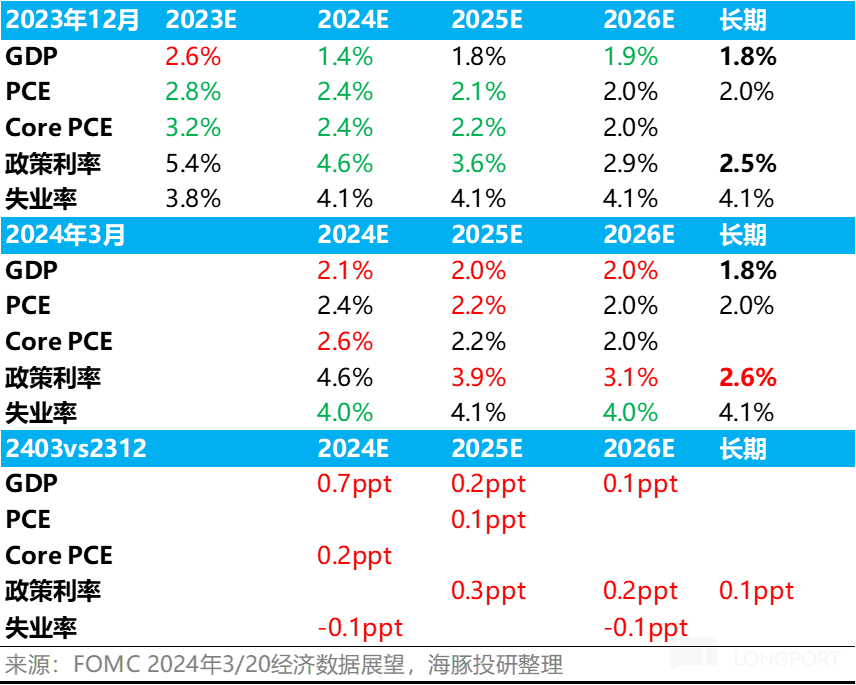
However, in the latest economic forecast by the Federal Reserve, it is evident that the Fed does not believe that core PCE will be around 3.5% this year, but rather around 2.6%, gradually stabilizing to 2% over the next two years. Such a judgment naturally leads to three rate cuts.
Therefore, the key judgment lies in whether the price index in the following months, amidst strong employment, robust consumer spending, and businesses emerging from inventory lows into a new capital expenditure cycle, will be a continuation of the inflationary prelude seen in January and February, or as the Fed suggests - a temporary setback on the path to deflation?
Starting today, we are entering the period of the release of March macroeconomic data in the United States, and Dolphin will continue to observe. At least for now, with the strong fundamentals of the U.S. economy and the prospect of further rate cuts, Dolphin will not easily believe the Fed's statement that the inflation seen in January and February is just a minor fluctuation on the path to deflation, and that overall, inflation will continue to decline, dropping to a pace of 2.6% this year 3. Where is the market liquidity heading?
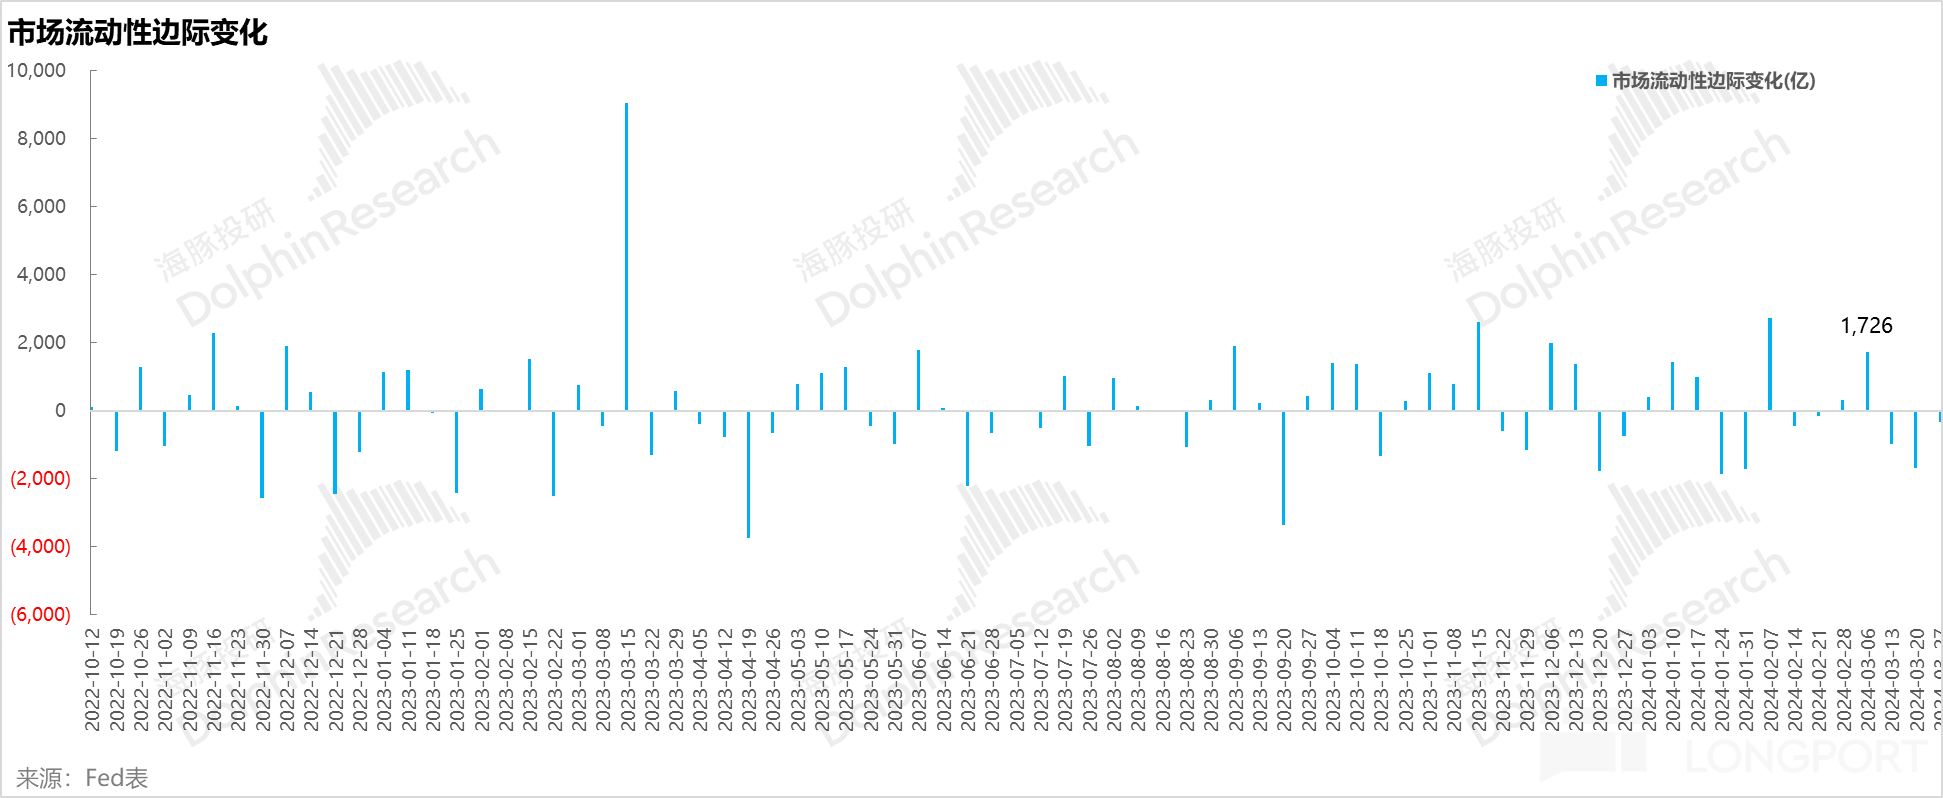
Since the Spring Festival, liquidity has been continuously increasing, with the usual pattern being a sharp drop of 150 billion US dollars after a week or two of reverse repurchase, supporting the market funds consumption for the next month. However, liquidity is still marginally growing.
There was a significant change last week, with excessive weekly fund consumption. The previous reduction after the most recent reverse repurchase was not enough, leading to the consumption of reserve balances. The reasons for this are as follows:
Starting from the week of March 15th, the BTFP balance began to decrease significantly, decreasing by less than 20 billion each week, with a total balance of 130 billion US dollars.
In addition, the TGA account balance has increased by over 20 billion, possibly related to the pace of treasury financing, coupled with the Fed's selling of short-term debt + MBS, resulting in a direct consumption of over 100 billion US dollars in reserves in the past two weeks, a relatively high magnitude.
However, in terms of quantity, the current reverse repurchase balance of around 850 billion corresponds to a monthly treasury selling volume of around 65 billion + a net monthly treasury financing amount of around 40 billion + a BTFP maturity amount of 150 billion (the current TGA account does not need to be replenished, and even has some room for release), supporting the current market liquidity without much problem.
In other words, it is unlikely to have a major liquidity impact before June, and liquidity will still be relatively "abundant" overall - this word is used by the Fed to describe the current liquidity, which in English itself implies some suspicion of being too much.
To summarize the above content: The current United States has a stable economic foundation + loose liquidity support, which means that the U.S. capital market in the second quarter is unlikely to be bad. Without increasing fiscal bloodsucking, Dolphin sees no significant opportunity for a major equity market correction, but rather seeks companies with stronger ability to generate performance alpha.
4. Portfolio Rebalancing and Returns
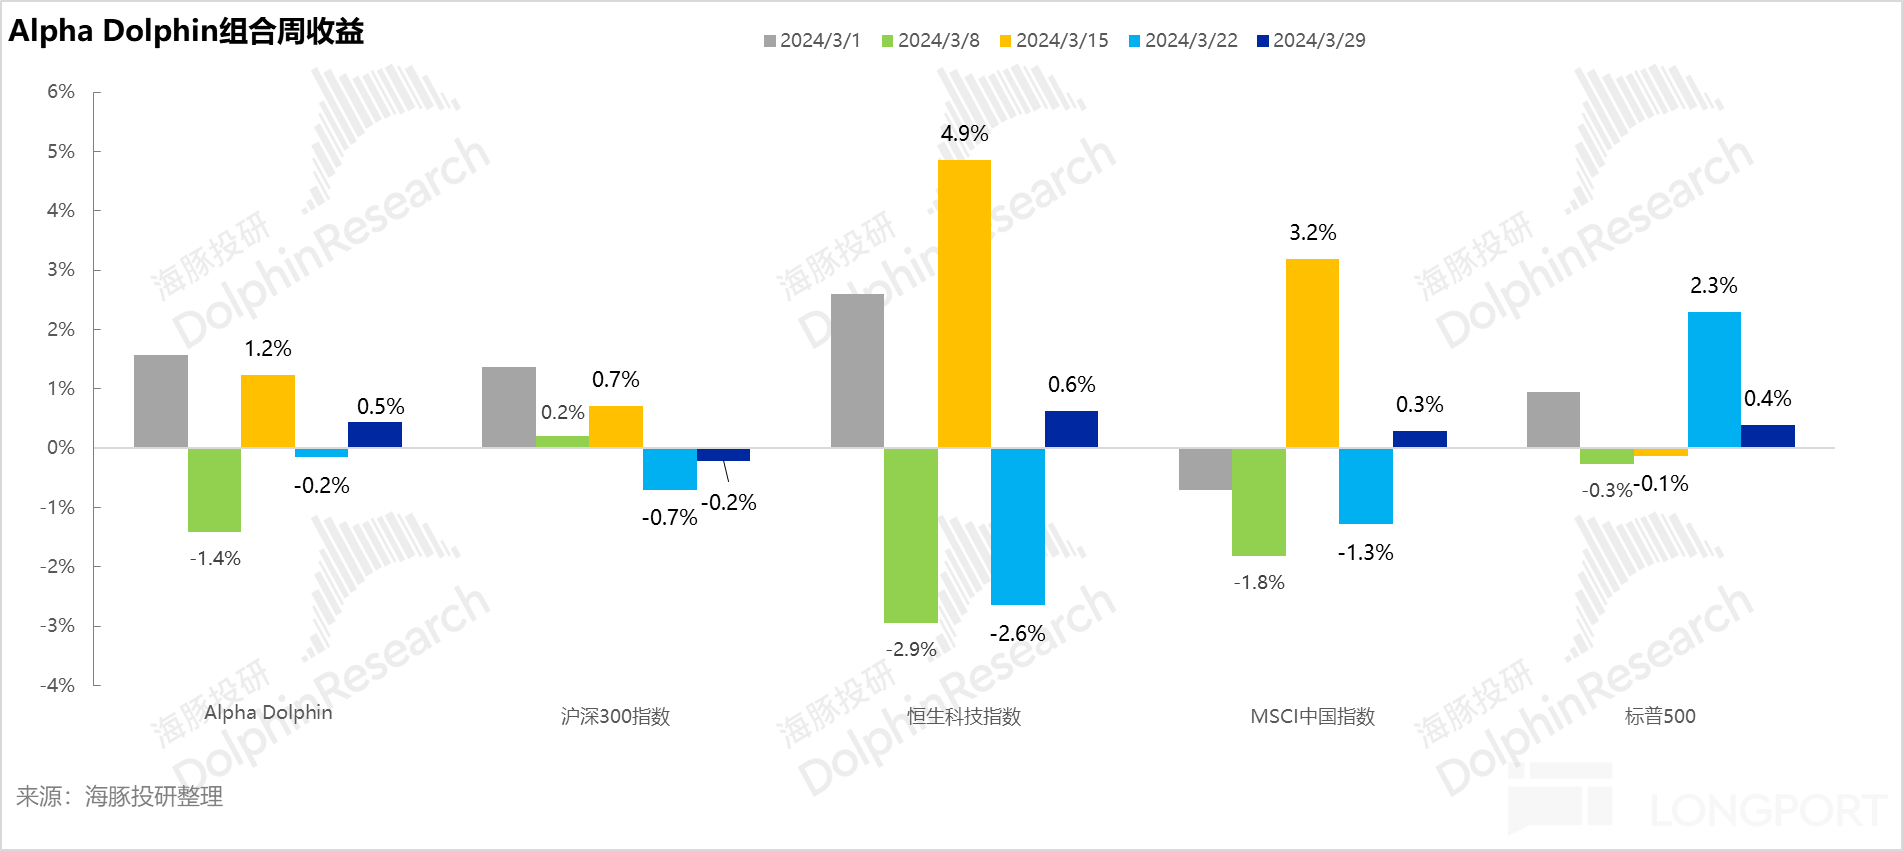
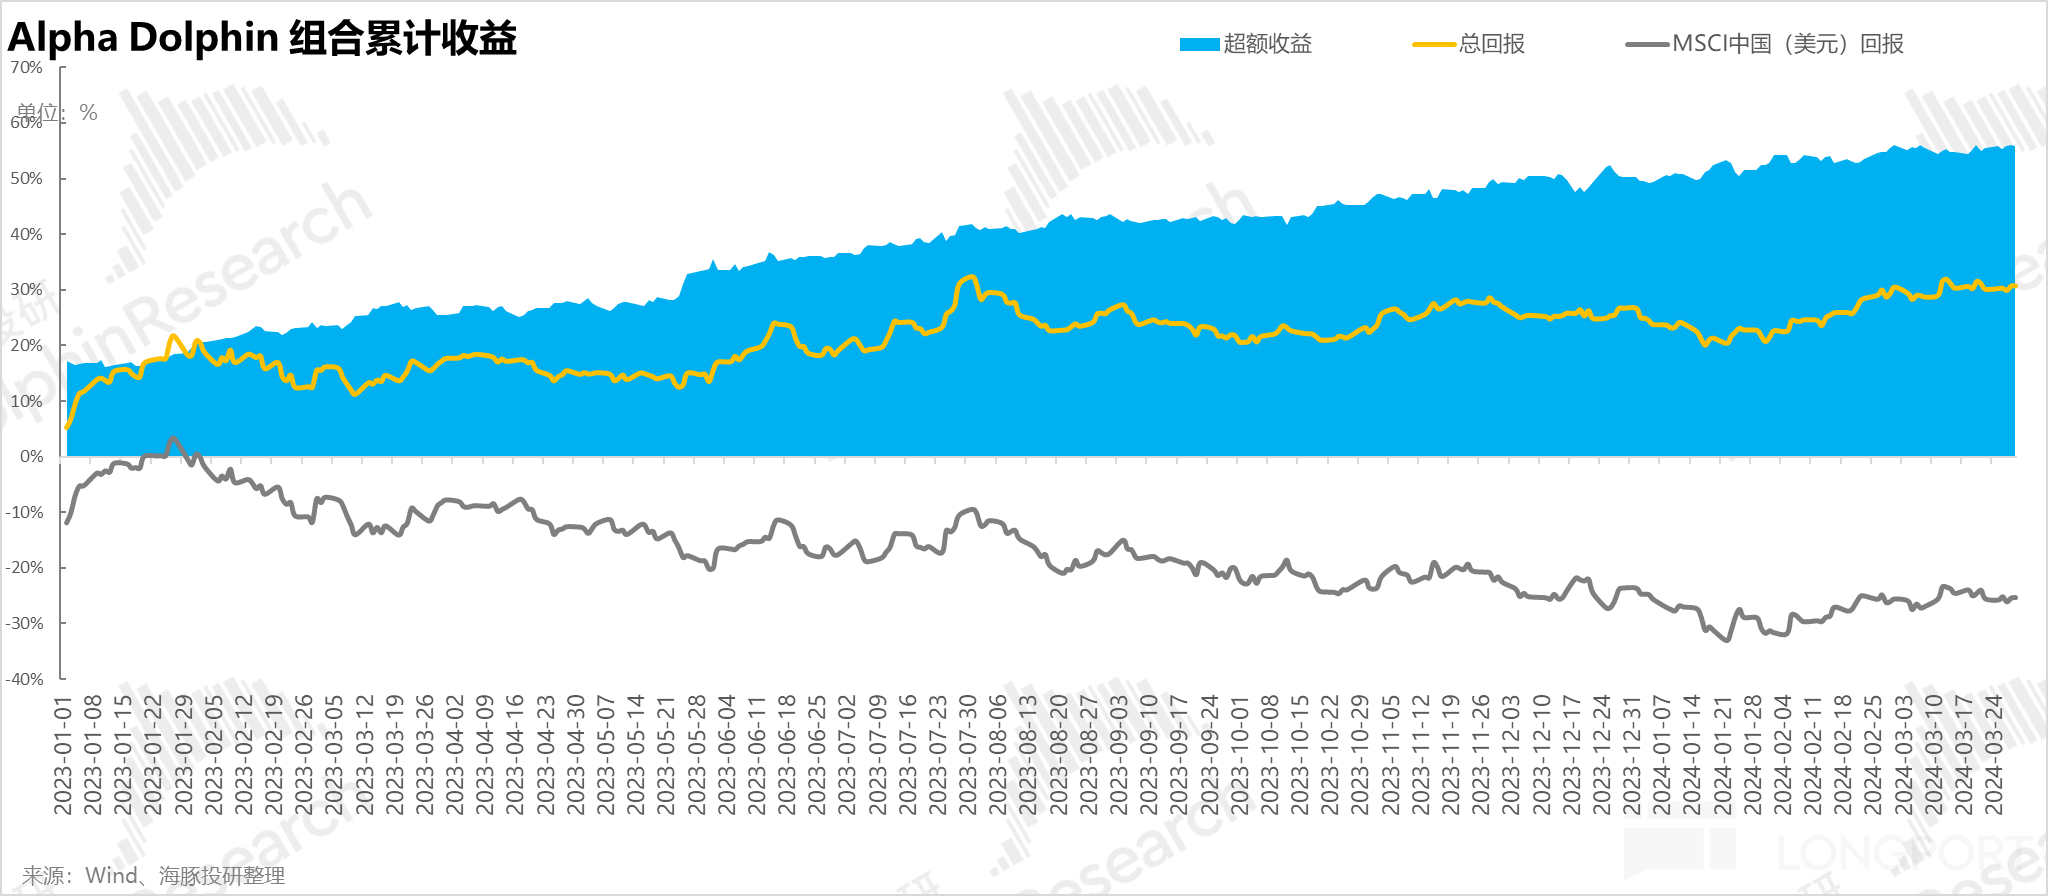
On the week of March 29th, the Alpha Dolphin virtual portfolio did not rebalance. By the end of the week, the portfolio's return slightly increased by 0.5%, which was basically on par with the S&P 500 (+0.4%) and Hang Seng Tech Index (+0.5%), slightly stronger than MSCI China (+0.3%) and Shanghai-Shenzhen 300 Index (-0.2%).
From the start of testing the portfolio to the end of last week, the absolute return of the portfolio was 30%, with an excess return compared to MSCI China of 55%. From the perspective of asset net value, Dolphin initially had a virtual asset of 100 million US dollars, which has now risen to 133 million US dollars Five, Individual Stock Profit and Loss Contribution
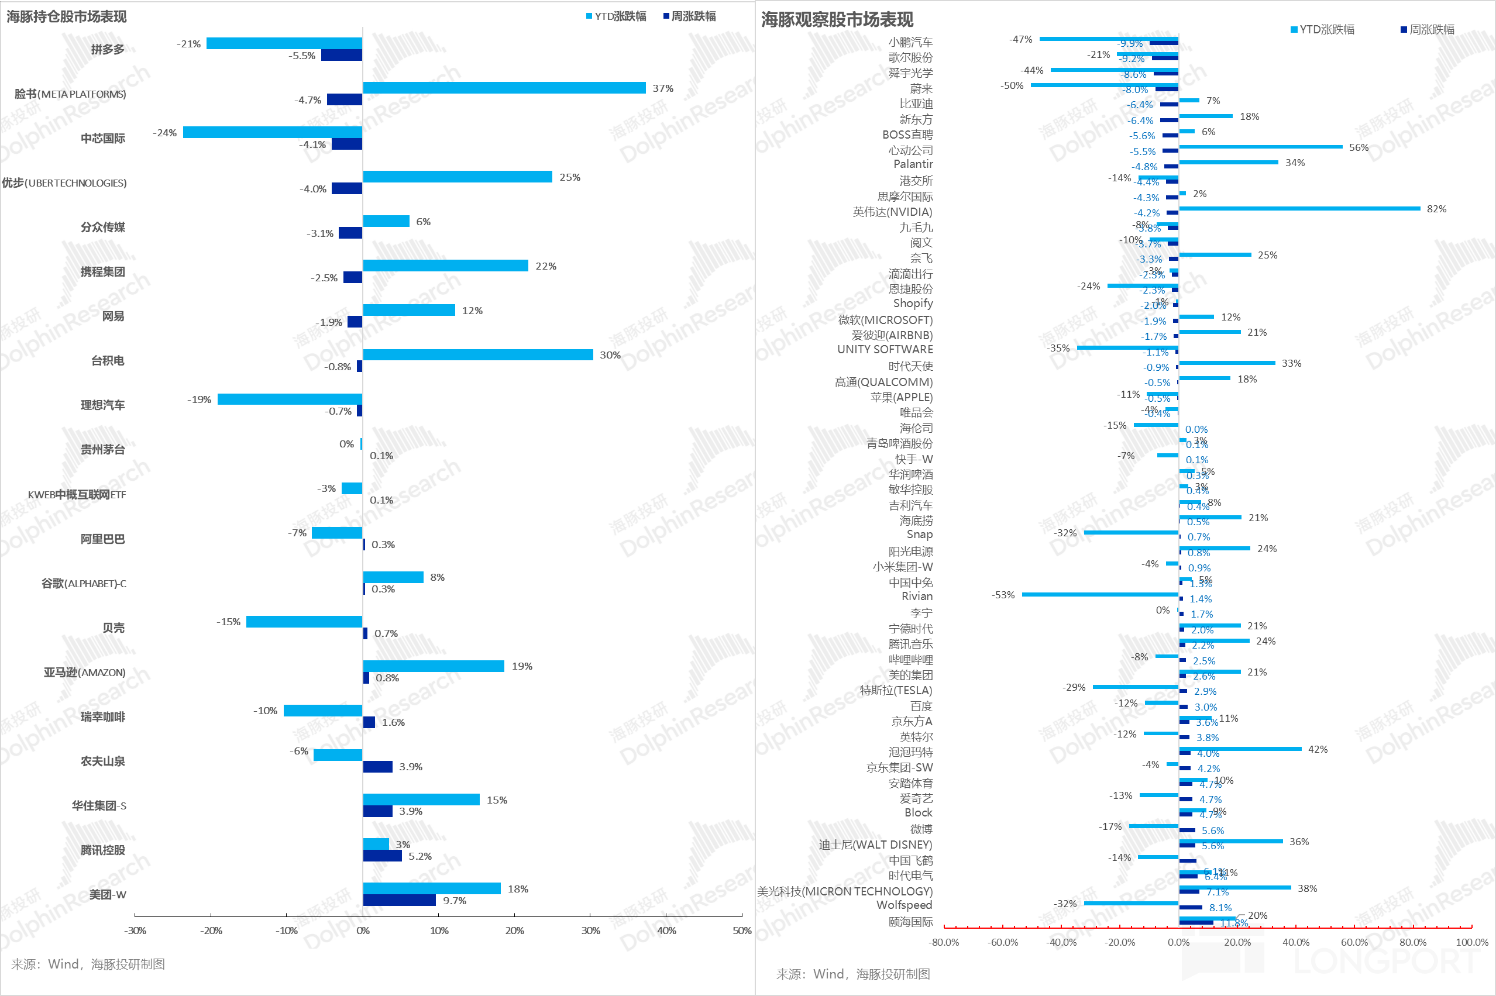
Last week, the overall market was in a low volatility state. Among the companies covered by Dolphin, Meituan's performance was much better than the sluggish expectations, while Tencent's stock price finally rebounded due to dividend support and some unconfirmed news stimulating the market, despite some funding pressures.
The entire new energy sector continued to decline after BYD's financial report was released and new forces continuously lowered delivery guidance. On the other hand, the semiconductor sector was driven by AI stories and traditional cycle repairs, leading to some companies experiencing rotational increases.
Six, Portfolio Asset Allocation
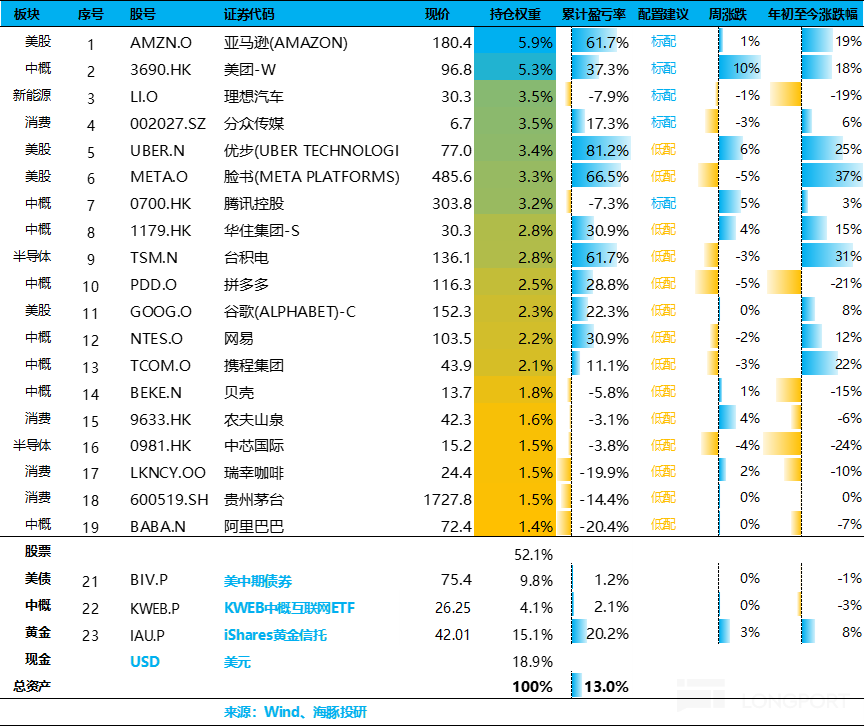
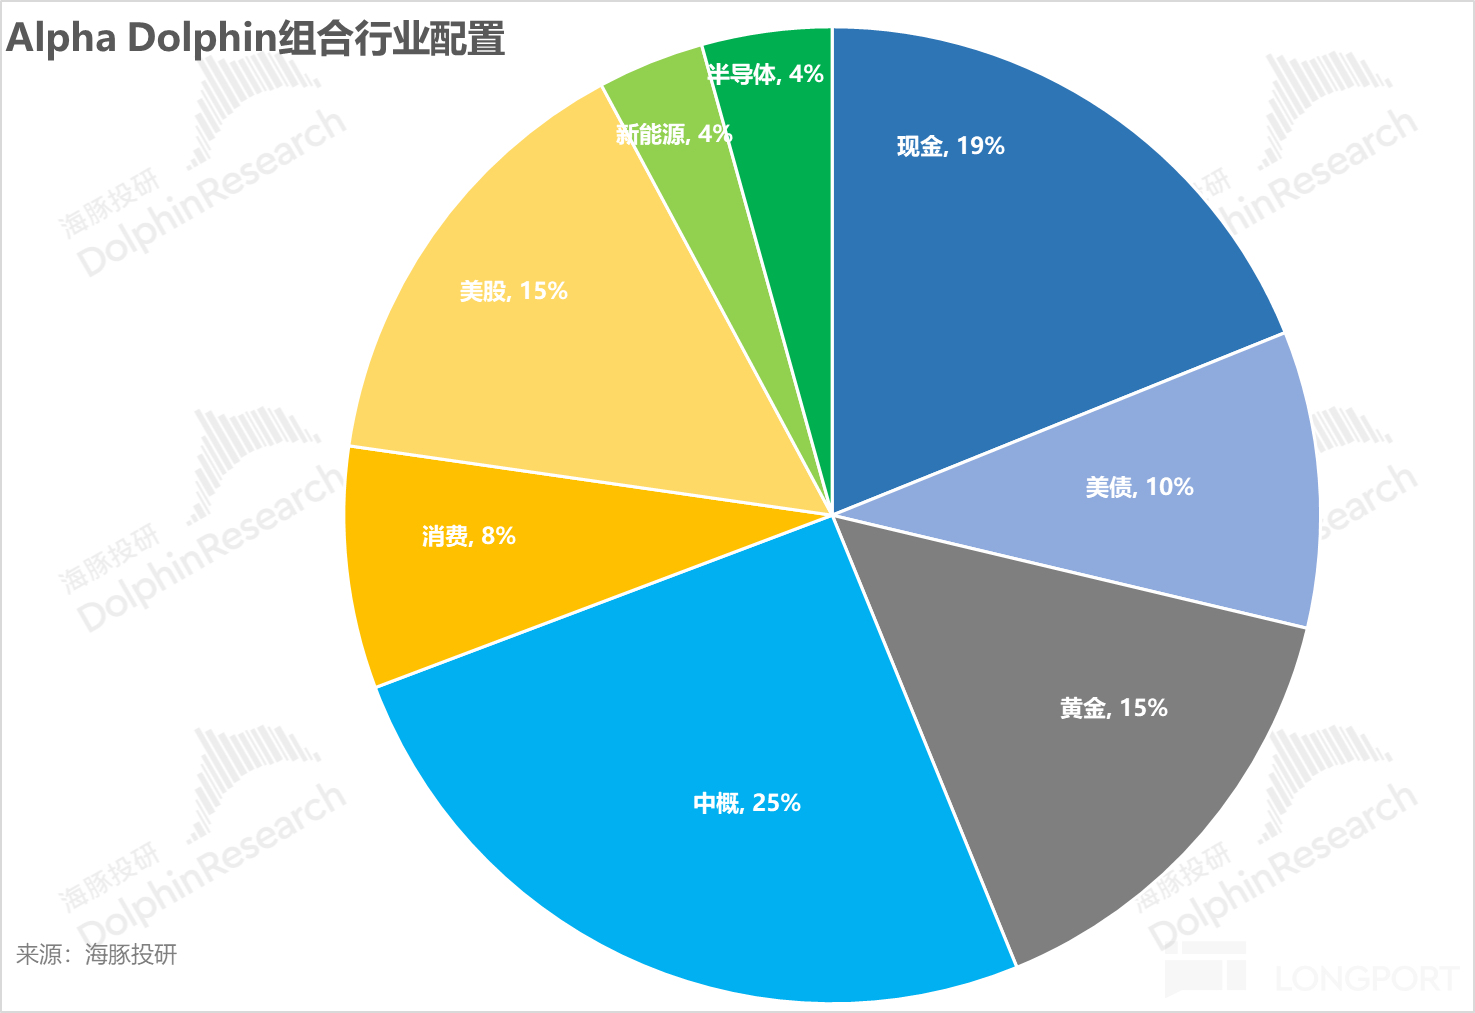
The Alpha Dolphin virtual portfolio holds a total of 20 individual stocks and equity ETFs, with 6 core holdings and the rest being underweighted equity assets, along with gold, US bonds, and US dollar cash.
As of the end of last week, the asset allocation and equity asset weighting of Alpha Dolphin are as follows:
Seven, Key Events This Week
The overseas Chinese asset financial reporting season has basically ended this week, with only assets listed on the A-share market releasing their performance reports. Among the A-share companies covered by Dolphin, only BOE and Kweichow Moutai will release their financial reports this week. Specific focus points are as follows:
[End of Text]
Risk Disclosure and Disclaimer for this Article: Dolphin Research Disclaimer and General Disclosure
For recent Dolphin Research Portfolio Weekly Reports, please refer to: 《Waiting for a big drop in US stocks to get on board? Not very hopeful》
《Low-grade inflation in the United States, can Chinese concept stocks still rise?》
《Dare not chase after the seven tech sisters? Chinese concept stocks unexpectedly benefit》
《Giants are stagnant, Chinese concept stocks are thriving, is it a last gasp or a style switch?》 《2024: Will the US economy avoid a hard landing?》
《At a critical moment again! Will Powell bail out the spendthrift Yellen?》
《Facing challenges head-on, how much faith can withstand the test?》
《Unstoppable deficits, supporting the dignity of US stocks》
《2024 US: Good economy, quick rate cuts? Too optimistic, will suffer losses》
《2023 US: Rebirth through self-destruction》 《The Fed makes a sharp turn, can Powell resist Yellen?》
《Year-end US stocks: Small gains are pleasing, big gains are harmful》
《Consumer demand cools down, is the US Fed really just a "tough talker" away from rate cuts?》
《US stocks are overdrawn again, is it finally the turn for Chinese concept stocks?》
《The belief in the never-setting sun of US stocks is back, is it reliable this time?》
《High interest rates cannot extinguish consumption, is the US really thriving or just a bubble?》
《The second half of the Fed's tightening, neither stocks nor bonds can escape!》 《This is the most down-to-earth way, Dolphin Investment Portfolio is launched》