
Based on a comparison of 38 countries: Why is our country's consumption rate relatively low?

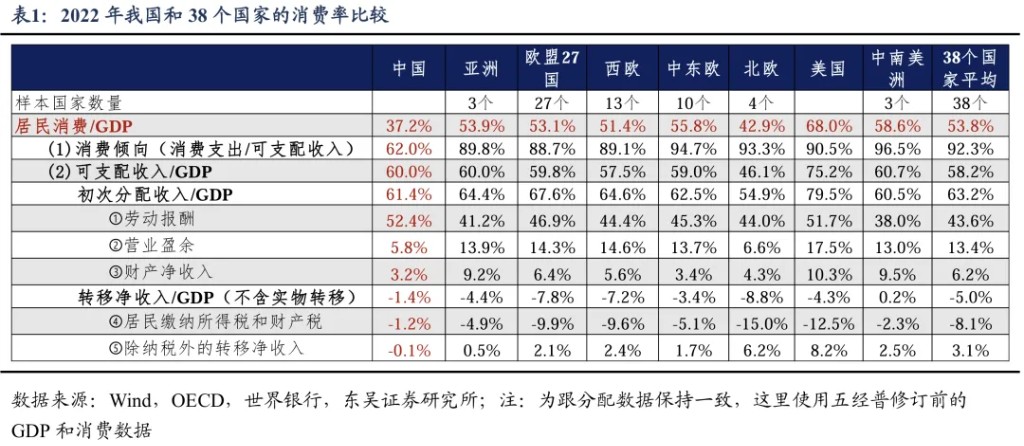
According to a comparison of 38 countries, China's household consumption rate is 37.2%, lower than the average level of 53.8%. The main reason is the low consumption propensity, which was 62% in 2022, far below the 92.3% of other countries. Although the disposable income of residents accounts for 60% of GDP, slightly higher than the average level, the proportion of primary distribution income and the level of net property income are relatively low, affecting consumption capacity. Increasing the income of low- and middle-income earners remains an important option to promote consumption
Core Viewpoints
We decompose the resident consumption rate into two categories of six factors and conduct an international comparison with 38 countries. Through this comparison, we find that the main reason for the low resident consumption rate in our country is the low consumption propensity. The proportion of disposable income is not low, but this may not mean that the resident sector "has money but is unwilling to spend." Increasing the income of low- and middle-income earners remains an important option to promote consumption.
Our main conclusions are as follows:
1. The resident consumption rate in China is only 37.2%, which is 16.6 percentage points lower than the average level of 38 countries (53.8%). According to: resident consumption rate = resident consumption expenditure/GDP = (resident consumption expenditure/resident disposable income) * (resident disposable income/GDP) = consumption propensity * resident income proportion, we will next break down the consumption propensity and resident income in detail.
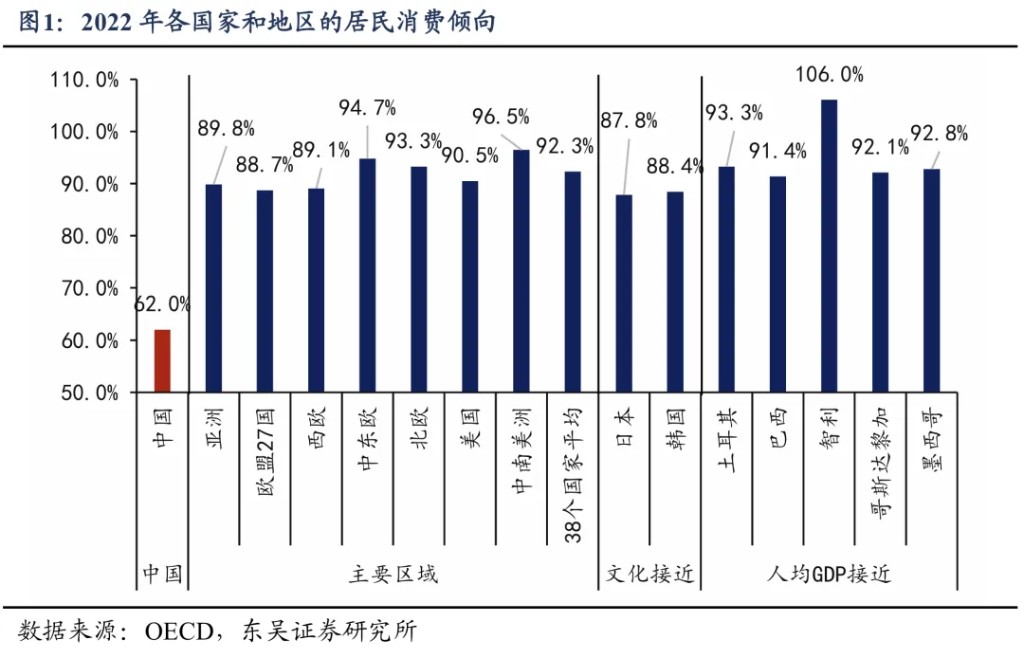
2. The low consumption rate in China is mainly due to the low consumption propensity. In 2022, the consumption propensity of residents in our country was 62%, while the average for 38 countries was 92.3%, with Luxembourg having the lowest at 82.1%.
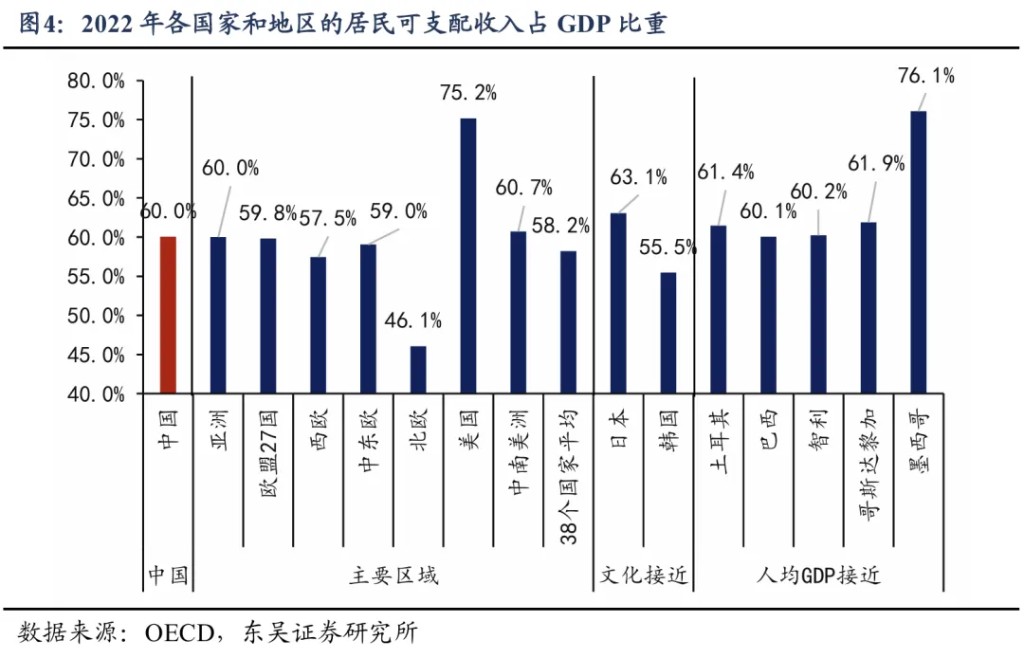
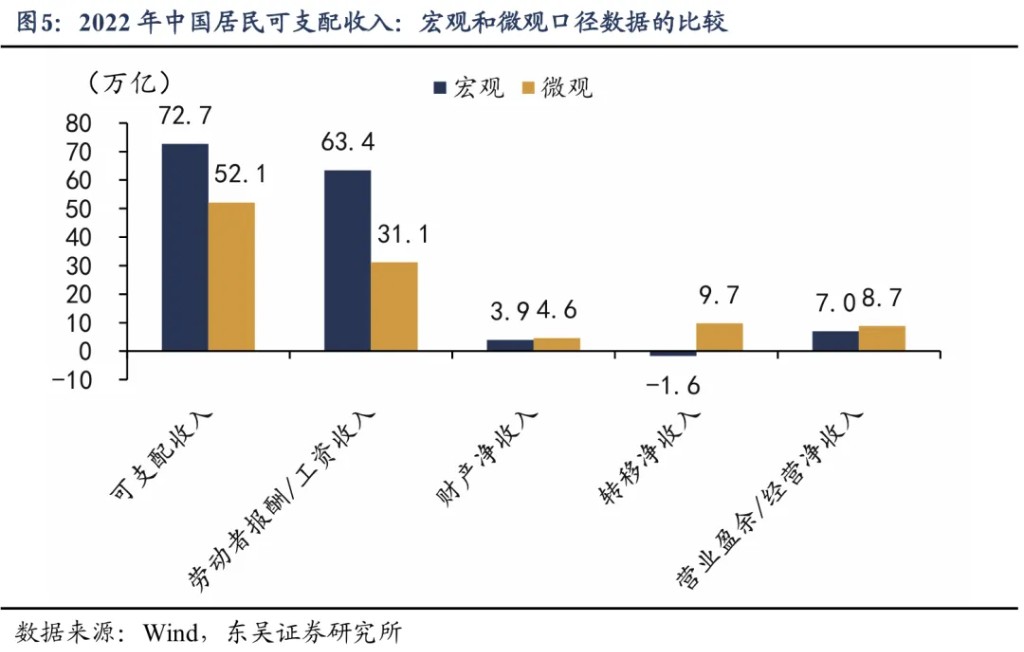
3. The disposable income of residents in our country is not low. In 2022, the disposable income of the resident sector accounted for 60% of GDP, slightly higher than the average level of 38 countries (58.2%). Many viewpoints believe that the low proportion of resident income in China compared to other countries stems from two issues: first, sample selection errors, as the countries often used for comparison have higher resident income proportions than ours, such as the United States (75.2%), Japan (63.1%), the United Kingdom (63.7%), France (64.5%), and Germany (63.2%). However, the Nordic countries or the overall EU 27 countries, which are not often compared, have lower resident income proportions than ours. Second, there are differences in definitions; many viewpoints use China's micro income definition, but in 2022, the micro data for resident income was 20 trillion yuan less than the macro data.
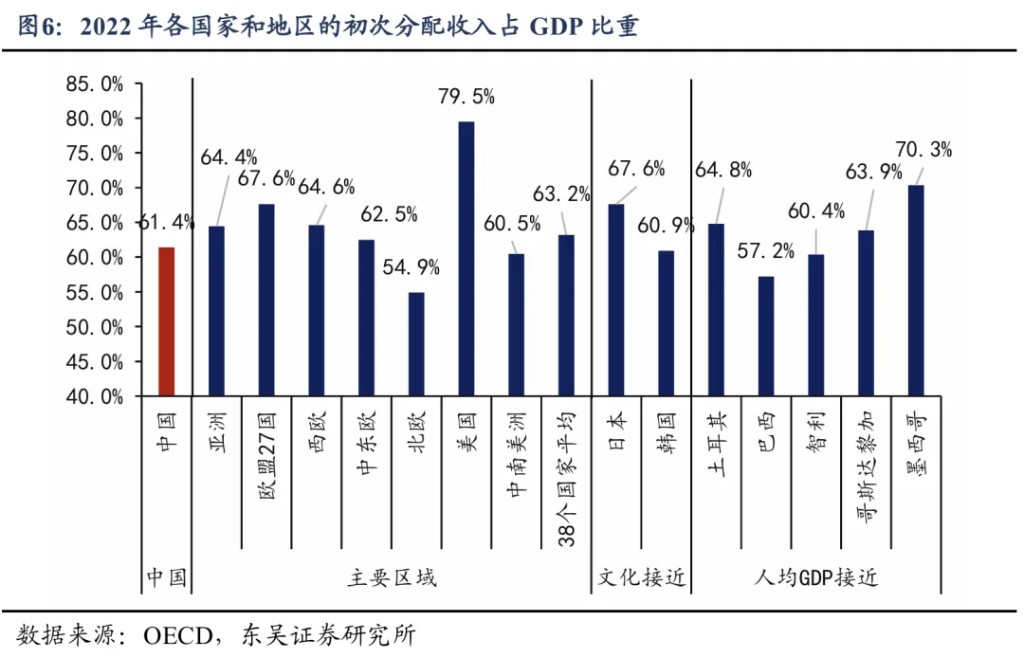
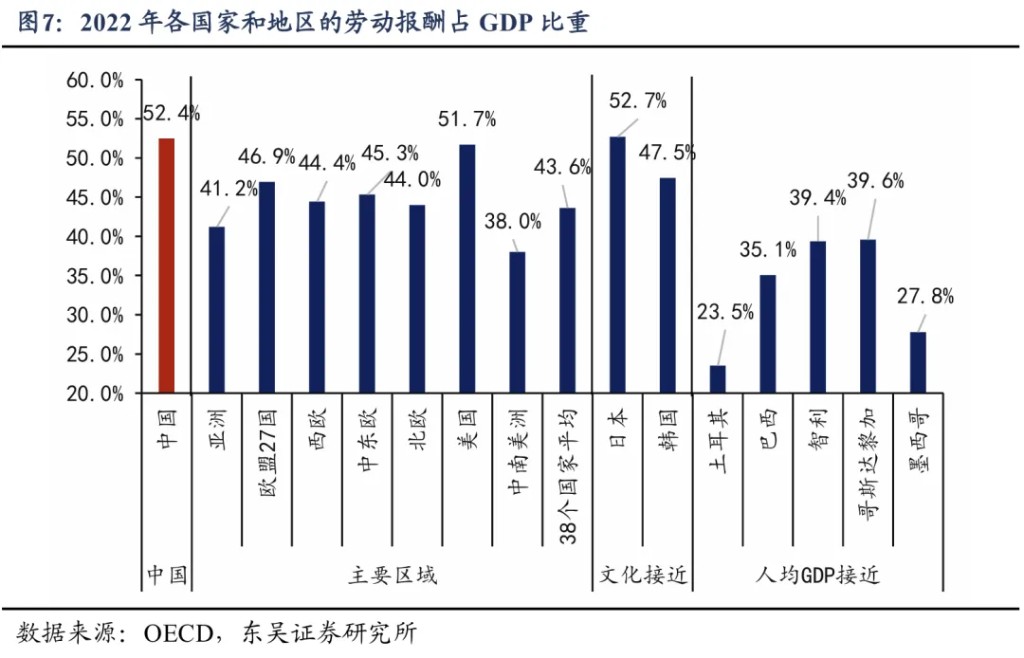
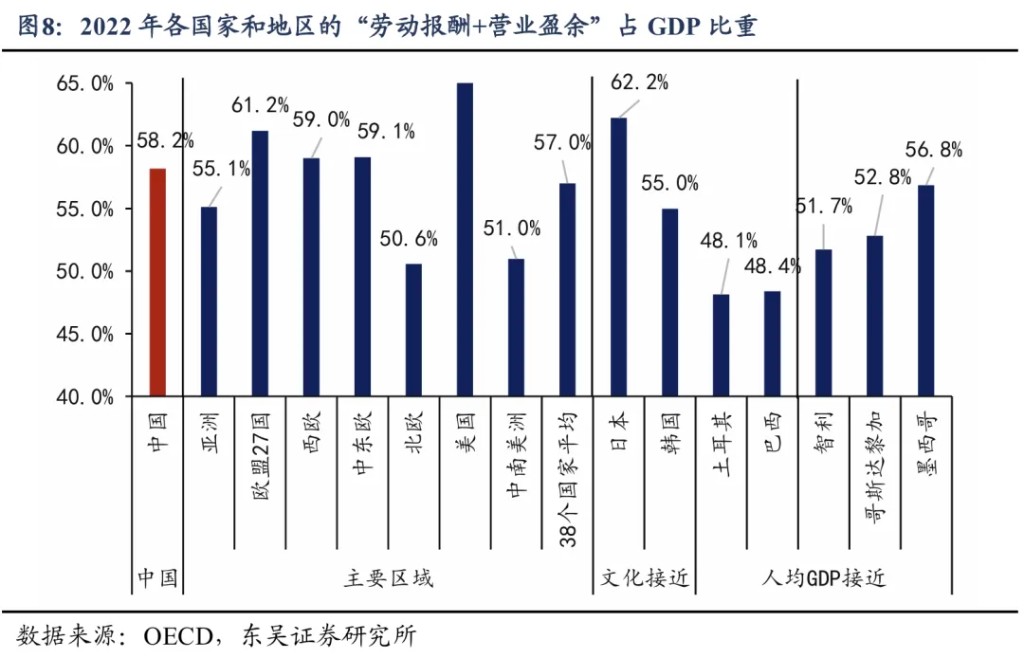
4. The proportion of initial distribution income of residents in our country (61.4%) is lower than the average of 38 countries (63.2%). However, the non-property income in the initial distribution, especially labor income, is not low. According to "labor remuneration + operating surplus," China is at 58.2%, while the average for 38 countries is 57%.
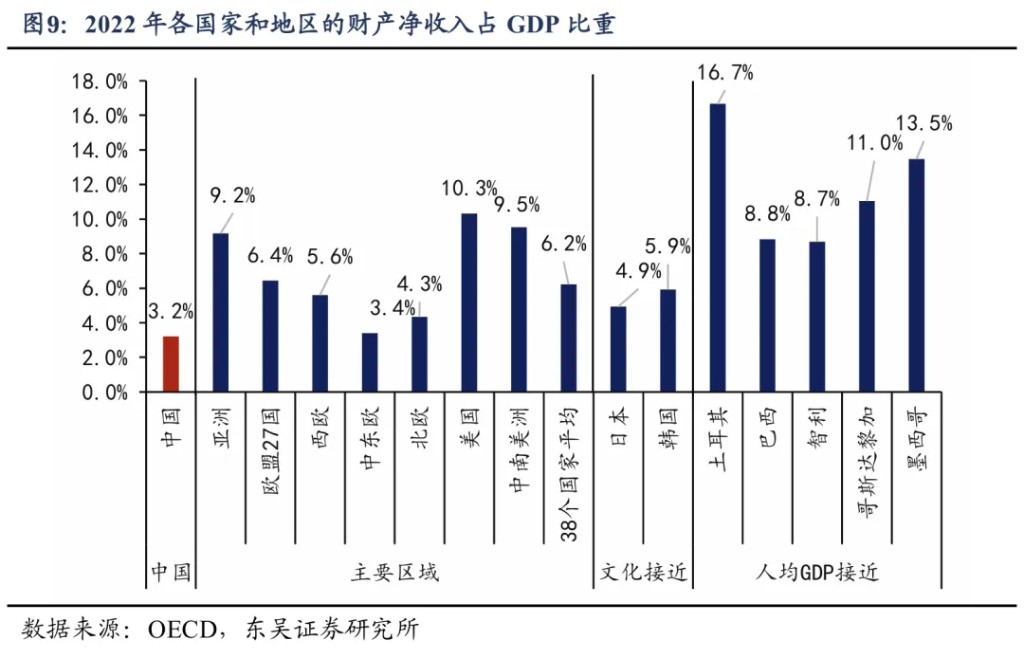
5. The low level of net property income is the main reason why the initial distribution income of residents in our country is lower than that of other countries. In 2022, the net property income of residents in our country accounted for 3.2% of GDP, while the average for 38 countries was 6.2%.
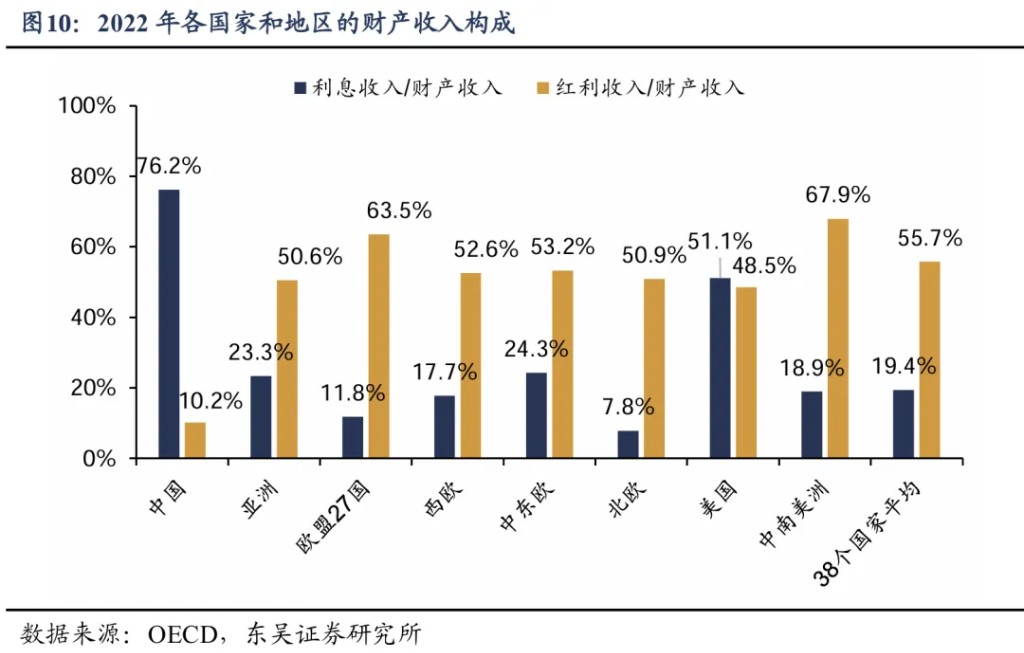
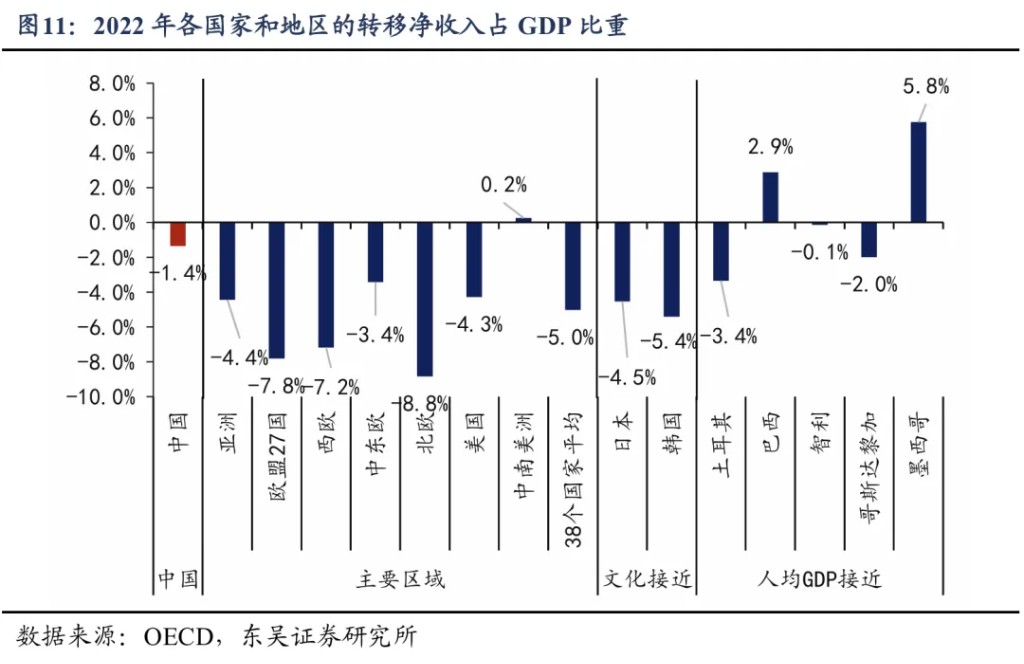
6. The forms of property income for residents in our country are singular, mainly relying on deposit interest, and the dividends paid to residents by enterprises are significantly lower than the global average. In 2022, 76.2% of property income in our country came from interest income, while only 10.2% came from corporate dividends, indicating that residents' property income relies on deposit interest, and corporate dividends are too low. In contrast, the average for 38 countries shows that interest income accounts for only 19.4% of property income, while dividend income accounts for as much as 55.7% of property income 7. In the secondary distribution stage, in 2022, the net transfer income of residents in China accounted for -1.4% of GDP, which is 3.6 percentage points higher than the average of -5.0% in 38 countries.
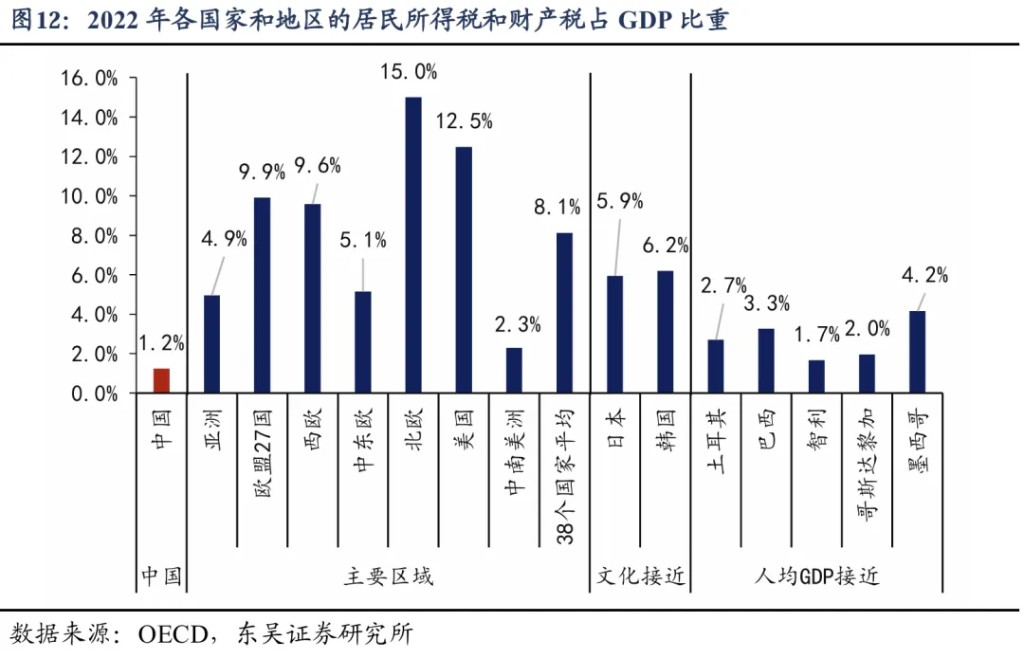
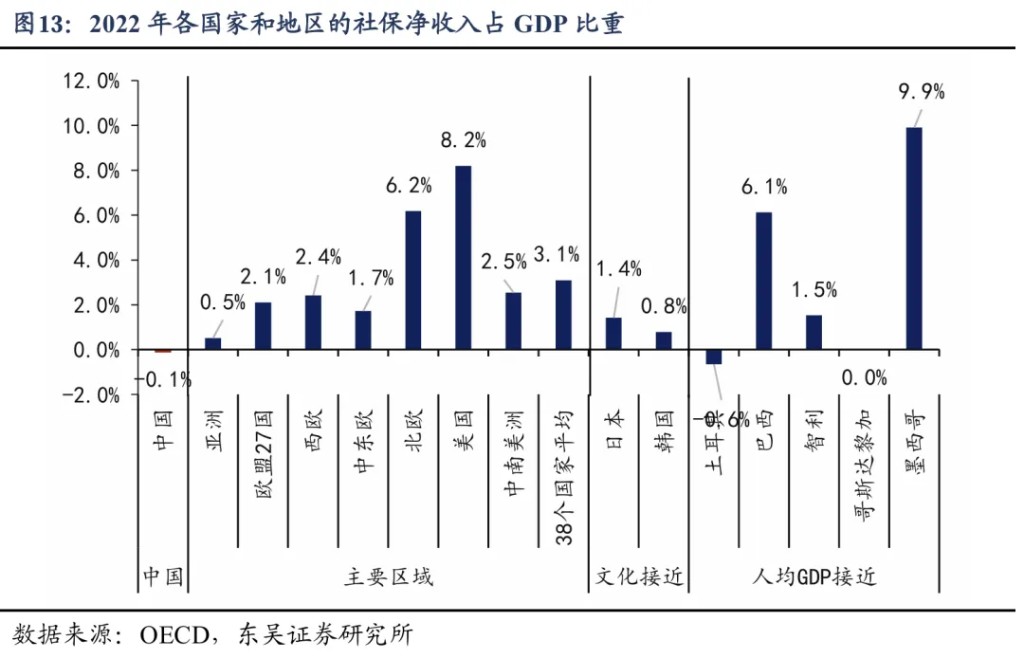
8. The relatively high net transfer income of residents in China is mainly due to the light tax burden. The net transfer income of residents = income tax and property tax paid by residents + net transfer income excluding taxes. In 2022, the proportion of income tax and property tax paid by residents in China was only 1.2% of GDP, which is 6.9 percentage points lower than the average level of 8.1% in 38 countries; the proportion of "net transfer income excluding taxes" for residents in China was -0.1% of GDP, while the average for 38 countries was 3.1%, indicating relatively insufficient social security protection.
9. Since the proportion of disposable income for residents in China is higher than the international average and the consumption tendency is lower than the international average, does this indicate that the resident sector in China "has money but is unwilling to spend"? Not necessarily. Since individual income tax and property tax mainly affect a small number of middle and high-income earners, excluding middle and high-income earners, the international comparison of income proportions for most residents in China may be 61.3% vs. 66.3%, rather than 60% vs. 58.2%. That is, middle and high-income earners exhibit a phenomenon of "having money but not spending," but most residents still have a willingness to consume but lack the ability to consume. Therefore, the statement made at the Political Bureau meeting in April 2025 that "it is necessary to increase the income of the middle and low-income groups" is very necessary.
10. The light tax burden of individual income tax and property tax does not necessarily benefit consumption. The "double low" pattern of tax burden and net income from social security for residents in China means that the secondary distribution stage has not fully played its role in adjusting income disparities, which is not conducive to promoting consumption. We found that if the tax burden of individual income tax and property tax for residents is raised to be consistent with the average level of 38 countries, and if the tax burden is increased while also increasing the level of transfer payments, the additional tax revenue can be entirely given to middle and low-income earners in the form of transfer payments, which can result in an increase in total income for the resident sector remaining unchanged, while resident consumption increases by 1.6 trillion, the consumption rate increases by 1.3 percentage points, and the consumption tendency increases by 2.2 percentage points.
Content Directory
1. Consumption tendency has a greater impact than resident income
2. Disposable income in China is slightly higher than the average of 38 countries
3. Primary distribution is lower than the average of 38 countries, mainly due to low net property income
3.1. The proportion of labor remuneration is relatively high, mainly due to statistical caliber issues
3.2. Low property income, mainly due to insufficient corporate dividends
4. Secondary distribution is higher than the average of 38 countries: low tax burden and low social security income
5. Insights from the comparison of 38 countries: Do residents in China "have money but are unwilling to spend"?
Main Text
We selected 38 countries with comparable data for a breakdown comparison of resident consumption, including 3 from Asia (Japan, South Korea, Turkey), 27 from the European Union, 3 from North America (the US, Canada, Mexico), 3 from Central and South America (Brazil, Chile, Costa Rica), 1 from Africa (South Africa), and 1 from Oceania (New Zealand), with the latest data being from the year 2022 Overall, in 2022, China's household consumption rate was only 37.2%, which is 16.6 percentage points lower than the average level of 53.8% in 38 countries.
To study why China's consumption rate is low, we break down the household consumption rate into 6 factors and conduct international comparisons for each factor. According to the formula:
Household consumption rate = Household consumption expenditure / GDP = (Household consumption expenditure / Household disposable income) * (Household disposable income / GDP) = Consumption propensity * Proportion of household income
The first factor is consumption propensity, and the other five are income factors, including labor remuneration in the primary distribution stage, operating surplus, net property income, as well as income tax and property tax paid by residents in the secondary distribution stage, and net transfer income excluding taxes.
1. Consumption propensity has a greater impact than household income
The low consumption rate in China is mainly due to the low consumption propensity. In 2022, China's household consumption propensity was 62%, while the average for 38 countries was 92.3%, with Luxembourg having the lowest at 82.1%. China's consumption propensity is about 30 percentage points lower than the average level and about 20 percentage points lower than the lowest level among the 38 countries. In Japan and South Korea, which are geographically and culturally similar to China, the consumption propensity is around 88%; among the 5 countries with a per capita GDP close to China's level (around $10,000, including Turkey, Brazil, Chile, Costa Rica, and Mexico), none had a consumption propensity lower than 90%.
The low consumption propensity in China is not caused by a single factor, but is the result of multiple influences, including:
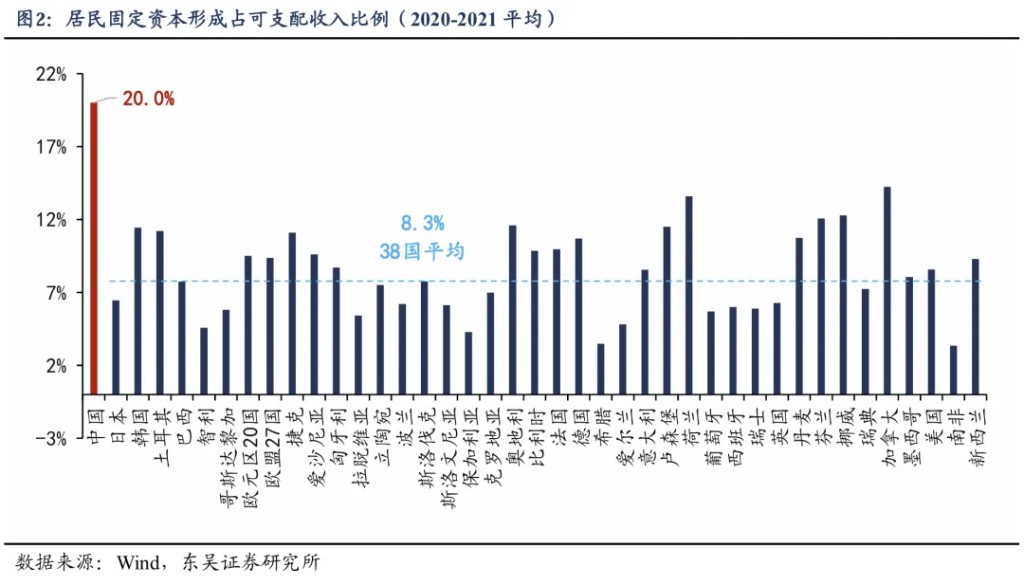
First, the impact of real estate on consumption propensity is significant, reaching up to 11.7 percentage points. Before 2021, China's housing price-to-income ratio was high, and families needed to save a large portion of their income for a long time to afford housing, which directly reduced current consumption; after purchasing a home, mortgage repayments continued, and savings did not stop. The ratio of fixed capital formation to disposable income in the cash flow statement can roughly measure the impact of real estate on consumption propensity. From 2020 to 2021, an average of 20% of China's household disposable income was used for fixed asset investment (mainly for purchasing homes), while the average for 38 countries was 8.3%. If the portion exceeding the global average could be converted into consumption, China's consumption propensity could increase by 11.7 percentage points. However, since mid-2021, during this round of real estate downturn, although residents reduced housing expenditures (the proportion of disposable income used for fixed asset investment fell from 20% to 15.9%), they increased precautionary savings, and the funds released from the real estate market did not enter consumption, thus there was little change in consumption propensity
Second, the cultural tradition of thrift and a preference for saving have also suppressed consumption tendencies. For example, in 2022, the consumption tendency in Japan and South Korea, which have similar cultures, was about 4 percentage points lower than that of other countries, but this is not enough to explain the gap of over twenty percentage points between China's consumption tendency and that of Japan and South Korea.
Third, the social security system is inadequate. The shortcomings of the social security system force families to increase savings for future uncertainties, thereby reducing current consumption levels.
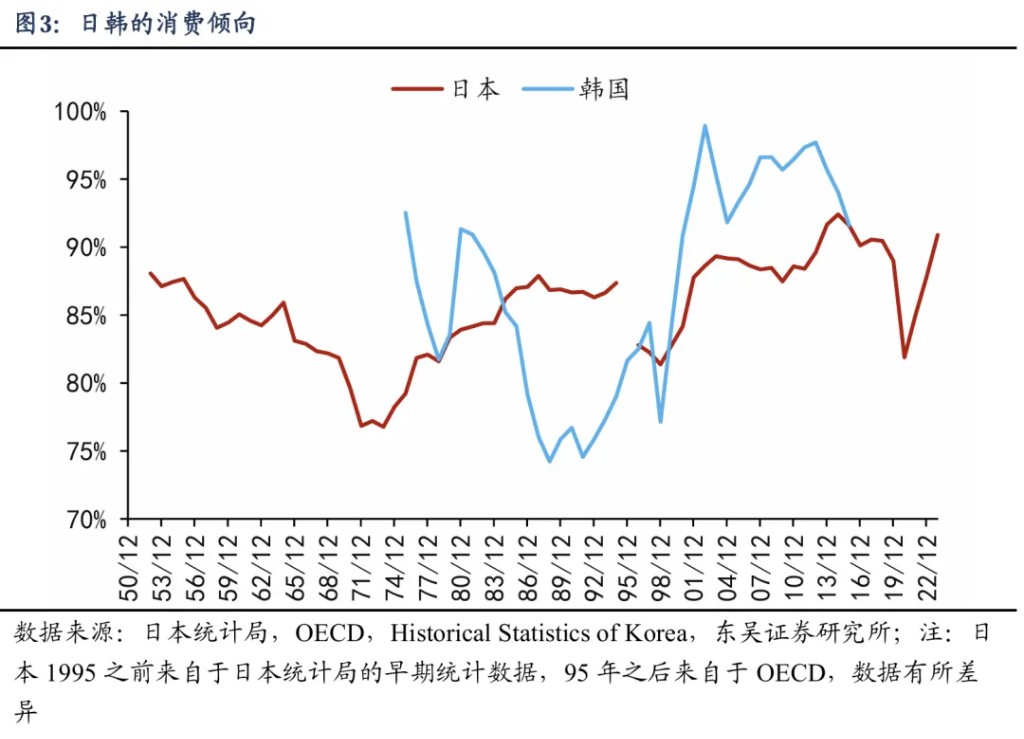
Fourth, the development path prioritizes investment over consumption. The opposite of consumption tendency is the savings rate, which is usually higher in the early stages of development when various economic systems are more inclined towards investment and accumulation, corresponding to higher investment rates, savings rates, and lower consumption tendencies. For instance, Japan and South Korea's consumption tendencies exhibit a clear U-shaped trend; in the early stages of industrialization, the economic system emphasizes investment over consumption, leading to a decline in consumption tendency; while in the later stages of industrialization, there is a transition from an investment-oriented society to a consumption-oriented society, with improvements in systems such as household income, vacations, social security, and consumption environment, resulting in a rebound in consumption tendency. For Japan and South Korea, the consumption tendencies of both countries reached their lowest points in the early 1970s and late 1980s, respectively, before rebounding.
2. China's disposable income slightly higher than the average of 38 countries
In 2022, the disposable income of China's resident sector accounted for 60% of GDP, slightly higher than the average level of 38 countries (58.2%). Many viewpoints suggest that the proportion of residents' income in China is lower than that of other countries, and two reasons have led to the widespread dissemination of this erroneous viewpoint.
First, there is a sample selection error; the countries often used for comparison have a higher proportion of residents' income than China, such as the United States (75.2%), Japan (63.1%), the United Kingdom (63.7%), France (64.5%), and Germany (63.2%). However, if we look at more regions, we will find that there are many countries where the proportion of residents' income is lower than that of China, such as the average proportion of residents' income in the four Nordic countries is only 46.1%, and the average for the 27 EU countries is 59.8%, both lower than that of China.
Second, there are differences in definitions; many viewpoints use the micro income definition for China, but in 2022, the micro data on residents' income was 20 trillion yuan less than the macro data. In 2022, according to micro survey data from the statistical bureau, the per capita disposable income of Chinese residents was 36,800 yuan. Based on a population of 1.41 billion, the total residents' income was approximately 52 trillion yuan, while the GDP before the fifth census adjustment was 121 trillion yuan, making the proportion of disposable income based on micro definitions 43%. In contrast, the macro definition of disposable income is 72.7 trillion yuan, accounting for 60% of GDP, with a difference of 20 trillion yuan in income scale and a difference of 17 percentage points in proportion
3. Initial distribution is lower than the average of 38 countries, mainly due to low net property income
The proportion of initial distribution income of Chinese residents to GDP (61.4%) is lower than the average of 38 countries (63.2%), mainly due to low net property income, while other income is not low (labor remuneration + operating surplus).
3.1. The proportion of labor remuneration is relatively high, mainly due to statistical criteria issues
The proportion of labor remuneration in China is relatively high (China 52.4% vs. average of 38 countries 43.6%), mainly due to differences in statistical criteria. SNA2008 sets up a mixed income item, which includes the labor remuneration that self-employed individuals should receive in business and the surplus obtained by such enterprises, with mixed income usually grouped with operating surplus. However, in China, the labor remuneration and surplus of self-employed individuals (farmers and individual businesses) are separated and accounted for in the labor remuneration and operating surplus items of resident income respectively. In other words, the labor remuneration of residents in China includes the labor remuneration of self-employed individuals, resulting in a higher proportion of labor remuneration to GDP. In 2022, it was 52.4% in China, while the average of 38 countries was 43.6%. However, if we consider the differences in criteria and combine "labor remuneration + operating surplus," the difference is not significant, with China at 58.2% and the average of 38 countries at 57%.
3.1. Low property income, mainly due to insufficient corporate dividends
In addition to labor remuneration and operating surplus, initial distribution also includes net property income, which has two characteristics in China.
First, the net property income of Chinese residents is 3.2 percentage points lower than the average of 38 countries, which is the main reason for dragging down initial distribution income. In 2022, the net property income of Chinese residents accounted for 3.2% of GDP, while the average of 38 countries was 6.2%, indicating that the property income of Chinese residents is relatively low. The low level of net property income is the main reason why the initial distribution income of Chinese residents is lower than that of other countries Second, the forms of property income for residents in our country are singular, mainly relying on deposit interest, while the dividend income from enterprises to residents is significantly lower than the global average. In 2022, 76.2% of property income in our country came from interest income, while only 10.2% came from enterprise dividends, indicating that residents' property income relies on deposit interest, and enterprise dividends are too low. In contrast, on average across 38 countries, interest income accounted for only 19.4% of property income, while dividend income accounted for as much as 55.7%.
In Japan and South Korea, which have cultures similar to ours, the savings rate is also high, so 20.4% and 25.4% of property income comes from interest income, which is higher than the average of the 38 countries. However, the proportion of dividend income in property income for residents in Japan and South Korea reached 30.5% and 49.6%, respectively. In other countries, 51.1% of property income for residents in the United States comes from interest, and 48.5% comes from dividends, which is due to the interest rate hike cycle in 2022, where residents' interest income increased with rising interest rates.
4. Secondary distribution higher than the average of 38 countries: low tax burden and social security income
In 2022, the net transfer income of residents in our country accounted for -1.4% of GDP, higher than the average of 38 countries at -5.0%.
In the secondary distribution stage, the net income obtained by residents is negative, indicating that the secondary distribution is a transfer out of residents' income, which is the case in most countries. Among our sample of 38 countries, only 4 countries had a positive net transfer income of residents as a proportion of GDP in 2022, namely Brazil +2.9%, Bulgaria +0.5%, Portugal +1.2%, and Mexico +5.8%. Except for Portugal, the per capita GDP of the other three countries in 2022 did not reach the World Bank's high-income economy standard (USD 13,800). In the secondary distribution stage, residents' income decreases in most countries due to the existence of personal income tax and property tax. Only when the social security income received by the resident sector exceeds the "taxes + social security" paid can there be a possibility of net transfer income greater than 0.
The net transfer income of residents in our country is higher than the average of 38 countries, mainly due to the light burden of personal income tax and property tax. The net transfer income of residents can be divided into "income tax and property tax paid by residents" and "net transfer income excluding taxes," with the latter mainly being net social security income. In 2022, the proportion of income tax and property tax paid by residents accounted for only 1.2% of GDP, which is 6.9 percentage points lower than the average level of 8.1% for the 38 countries China's tax system is primarily based on indirect taxes. In 2023, value-added tax and consumption tax accounted for 47.2% of tax revenue, while personal income tax only accounted for 8.2%. Currently, the residential property tax is only piloted in Shanghai and Chongqing. Disposable income is post-tax income. With a focus on indirect taxes and low direct taxes such as personal income tax and property tax, this naturally helps to raise residents' post-tax income.
While the tax burden is light, social security income is relatively low. In 2022, the proportion of "net transfer income excluding taxes" for residents in China was -0.1% of GDP, while the average for 38 countries was 3.1%. Among the 38 sample countries, only 6 had a value less than 0, with most countries being positive. This indicator roughly represents the difference between social security contributions made by residents and the transfer payments received. A negative value indicates that the social security contributions made by residents exceed the transfer payments received.
The pension insurance for urban residents in China is not low, but rural pensions are low, and the unemployment insurance benefit rate is also low. According to the "2023 Statistical Bulletin on the Development of Human Resources and Social Security," in 2023, urban employee pension insurance expenditures in China amounted to 63,757 billion yuan, with 14.196 million recipients, averaging about 44,912 yuan per person per year. Meanwhile, basic pension insurance expenditures were 461.3 billion yuan, with 17.268 million recipients, averaging about 2,671 yuan per person per year, mainly due to low rural pensions. We have discussed the issue of unemployment insurance benefit rates multiple times in previous reports. According to the surveyed unemployment rate, by the end of 2023, among 24 million urban surveyed unemployed individuals, only 3.52 million received unemployment insurance, resulting in a benefit rate of only 14.7%. Considering that some of the 24 million individuals are not insured, with an insurance participation rate of 51.7%, the estimated insured benefit rate is about 28.3%. This means that among those who pay unemployment insurance, less than one-third can receive unemployment insurance after losing their jobs. (Refer to the external report in December 2024 titled "How Much Money is Needed to Increase the Income of 'Specific Groups'? — Exploring Consumption Space Series II")
A light tax burden for residents does not necessarily benefit consumption. Personal income tax and property tax typically play a role in regulating excessive income and reducing income disparity. The "double low" pattern of low tax burden and low net social security income for residents in China indicates that the redistribution process has not fully played its role in regulating income disparity, which is not conducive to promoting consumption.
5. Insights from the Comparison of 38 Countries: Are Residents in China "Reluctant to Spend"?
Compared to 38 countries, the low consumption rate of residents in China is mainly due to low consumption propensity (China 62% vs. average of 38 countries 92.3%), while the proportion of disposable income of residents in China to GDP is not low (China 60% vs. average of 38 countries 58.2%). Typically, the former represents consumption willingness The latter represents consumption capacity.
Does this mean that the resident sector in our country is not short of money, but rather "has money but is unwilling to spend"?
Not necessarily. The overall income of residents in our country is not lower than the international average, but most residents' income is still relatively low. The income share of the resident sector in our country is slightly higher than the average of 38 countries, indicating that when distributing income among the resident, enterprise, and government sectors, the resident sector as a whole receives a share of income that is not less than that of other countries. However, if we break it down in detail, we will find that the income obtained by residents in our country may still be relatively low. According to the proportion of "labor remuneration + operating surplus + net property income + net transfer income" to GDP, our country stands at 61.3%, which is significantly lower than the average level of 66.3% for the 38 countries. It is just that the income paid out by residents (individual income tax and property tax) is relatively low, so after tax adjustments, the income share of residents becomes: China 60% vs. 38-country average 58.2%.
Since individual income tax and property tax are borne more by middle and high-income earners, the lower payment of individual income tax and property tax also affects middle and high-income earners more. In the two sets of data 61.3% vs. 66.3% and 60% vs. 58.2%, the former may better reflect the international comparison of the income of most residents, while the latter includes a few middle and high-income earners in the international comparison. Therefore, focusing on the majority of residents, the income share may still be relatively low, indicating that middle and high-income earners exhibit a phenomenon of "having money but not spending" and a low consumption tendency, while most residents still have the willingness to consume but lack the capacity to do so. Therefore, the Politburo meeting in April 2025 pointed out that "it is necessary to increase the income of the middle and low-income groups," which is very necessary.
Let’s make a policy assumption: suppose we raise the tax burden of individual income tax and property tax for residents to be consistent with the average level of the 38 countries, and at the same time increase the level of transfer payments. The additional tax revenue will be entirely given to middle and low-income earners in the form of transfer payments, which is expected to increase the resident consumption rate by 1.3 percentage points. The calculation logic is as follows: the proportion of individual income tax and property tax of residents in our country to GDP is 6.9 percentage points lower than the average of the 38 countries. Based on the GDP of 121 trillion before the fifth national census, this amount of funds is approximately 8.3 trillion. Assuming that the consumption tendencies of middle and low-income earners and middle and high-income earners are 82.6% and 61.7% respectively, based on the consumption tendencies in rural and urban areas in 2022. Therefore, we can calculate that 8.3 trillion used for middle and high-income earners would bring about consumption of 5.3 trillion; while for middle and low-income earners, it would bring about consumption of 6.9 trillion. In other words, by improving the income adjustment effect of the secondary distribution process, it is possible to achieve an increase in total income of the resident sector while keeping it unchanged, resulting in an increase in resident consumption of 1.6 trillion, an increase in the resident consumption rate of 1.3 percentage points, and an increase in consumption tendency of 2.2 percentage points.
 Author of this article: Lu Zhe team from Soochow Securities, Source: Macro fans Zhe, Original title: "【Soochow Lu Zhe】Based on a comparison of 38 countries: Why is our consumption rate relatively low," edited by Wall Street Watch.
Risk Warning and Disclaimer
The market has risks, and investment requires caution. This article does not constitute personal investment advice and does not take into account the specific investment objectives, financial conditions, or needs of individual users. Users should consider whether any opinions, views, or conclusions in this article are suitable for their specific circumstances. Investment based on this is at one's own risk
